

SUI Gains Momentum as Strong Fundamentals Fuel Bullish Market Outlook

SUI trades near $1.12 as buyers defend $1.03 support, while positive MACD momentum and RSI at 74.7 keep traders focused on resistance.
SUI gained fresh market attention as its price recovered near $1.12 against USDT.
The move has drawn interest from traders watching support at $1.03, stronger network activity, and a possible shift in market structure.
The token still faces key resistance levels, but short-term momentum has improved on the daily chart.
SUI Market Shift Builds as Adoption Grows
SUI is drawing renewed interest as its price continues to rise. Analysts are watching the token after recent strength improved short-term sentiment.
The move has placed SUI among the crypto assets gaining wider focus.
The bullish outlook is supported by Sui’s fundamentals and growing adoption.
Market participants are tracking network activity, developer interest, and ecosystem growth. These factors may help support demand if adoption continues.
Investors are expected to keep monitoring SUI as it remains active in the market.
Price action will still play a key role in confirming the trend. Strong support and higher trading activity could shape the next phase.
SUI Moves From Accumulation Toward Expansion
Market Analysts have described SUI’s recent move as a transition from accumulation toward a faster expansion phase.
This view is based on the token’s move above the $1.03 area. That level had acted as resistance before buyers turned it into support.
The phrase “price discovery” has appeared in market commentary around SUI.
However, the daily chart shows the price remains below its previous high range. Price discovery would need a break above that old high zone.
Some traders are asking whether SUI could begin a larger parabolic run. That question depends on follow-through above nearby resistance.
The next important test is the $1.20 to $1.30 range. A clean daily close above that range could improve the short-term outlook.
It would also show stronger buyer control. Still, the larger trend needs a reclaim of higher resistance.
Read Also:
SUI Technical Analysis Shows Key Resistance Ahead
SUI is trading near $1.12 on the daily SUI/USDT chart. The token has recovered from the $0.90 to $1.20 base area.
Buyers have defended this zone, but the breakout is not yet confirmed. The main resistance remains near $1.72.
This level is important because it was a prior support area. A reclaim of $1.72 could open a path toward $2.23.
Further resistance levels sit near $2.63, $2.91, $3.19, $3.54, and $4.10. These levels may attract selling if SUI moves higher. They also mark areas where traders may take profit.
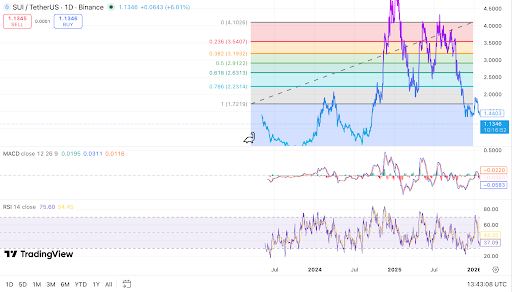 SUI tests recovery below major resistance, source : TradingView.
Momentum indicators show mixed conditions. The MACD is positive, with the MACD line above the signal line. This suggests stronger short-term buying pressure.
The RSI is near 74.7, which shows strong momentum. It also places SUI in overbought territory. This can lead to a pullback or sideways trading.
Support remains near $1.00 to $1.05. A break below this range could expose $0.80 to $0.90. A move above $1.30 would strengthen the near-term bullish case.
The post SUI Gains Momentum as Strong Fundamentals Fuel Bullish Market Outlook appeared first on Live Bitcoin News.


You May Also Like

DeepBook suffers $239.7K bad debt – What it means for leveraged DeFi

XRP Might Be Primed for Rapid Breakout


