

GBP/USD Technical Outlook: 61.8% Fibonacci Retracement at 1.3600 Caps Upside
BitcoinWorld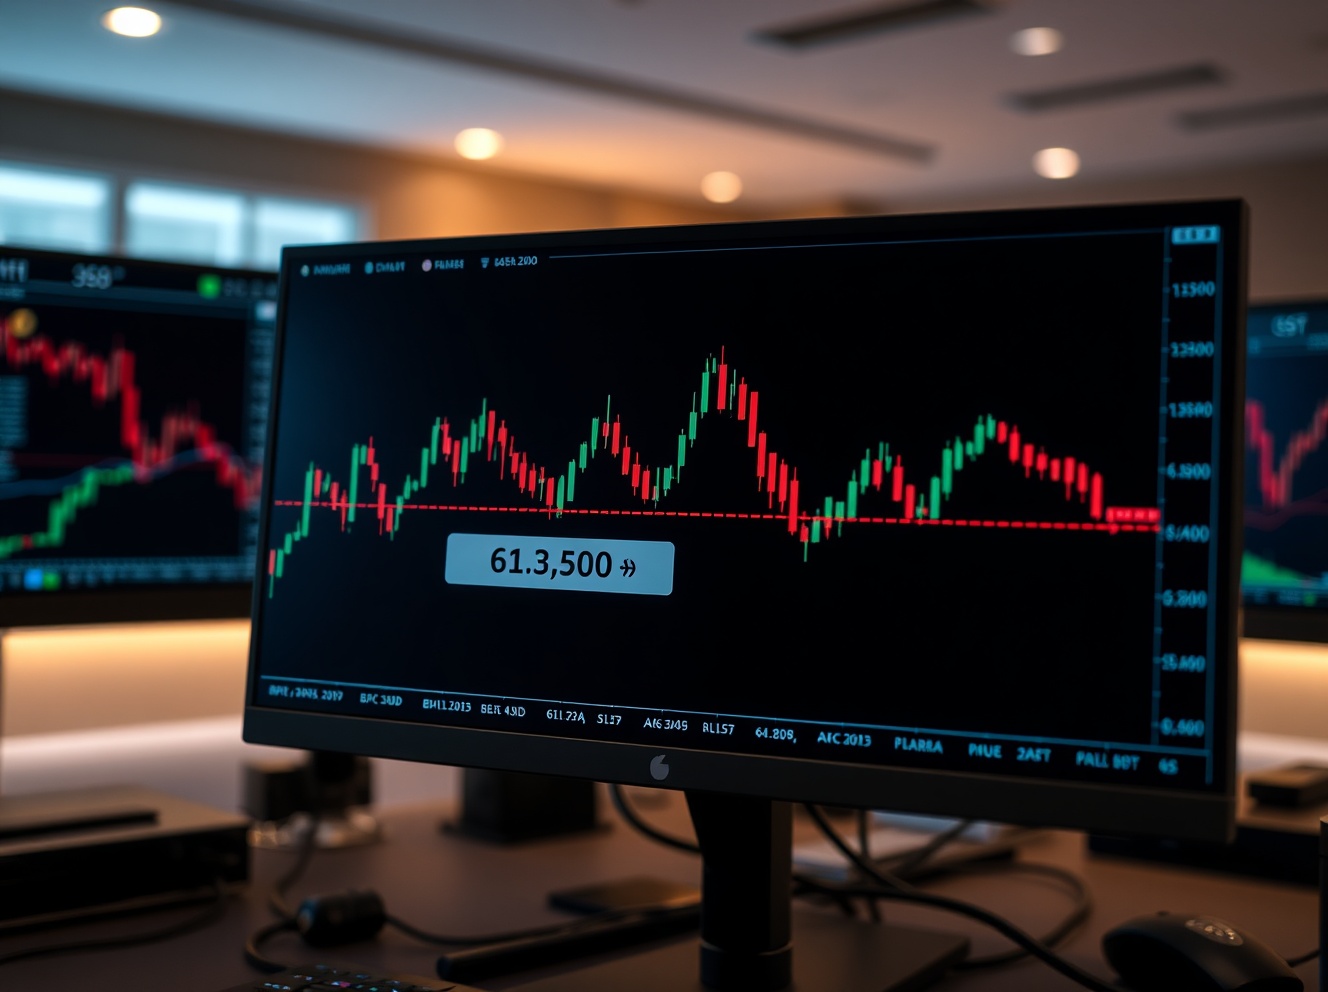
GBP/USD Technical Outlook: 61.8% Fibonacci Retracement at 1.3600 Caps Upside
The British pound’s recent recovery against the US dollar faces a critical technical test as the 61.8% Fibonacci retracement level near the 1.3600 handle continues to cap further upside. Traders are closely watching this zone for signs of a breakout or reversal, as it represents a key pivot point for the near-term trend.
Technical Barrier at 1.3600
The 61.8% Fibonacci retracement, drawn from the previous major swing low to the recent high, aligns almost perfectly with the psychological 1.3600 resistance level. This confluence creates a strong technical barrier that has repeatedly repelled price action over the past several trading sessions. A sustained move above this zone would likely open the path toward the next resistance cluster near 1.3700, while a rejection could signal a deeper pullback toward support levels around 1.3450 and 1.3400.
Momentum indicators on the daily chart are showing signs of waning bullish strength, with the Relative Strength Index (RSI) hovering near overbought territory. This suggests that buyers may need a fresh catalyst to drive the pair through the 1.3600 barrier. Key support below the current level lies at the 50-day moving average, which has provided a floor during recent dips.
Fundamental Context
The technical setup comes against a backdrop of shifting expectations for both the Bank of England and the Federal Reserve. Recent UK inflation data has remained stickier than anticipated, reinforcing expectations that the BoE may maintain a cautious approach to rate cuts. Meanwhile, the dollar has found some support from resilient US economic data, though market pricing for Fed rate cuts later this year continues to cap the greenback’s upside.
This tug-of-war between central bank policy expectations is a primary driver of the pair’s recent range-bound behavior. The 1.3600 level has acted as a magnet for price action, and a breakout in either direction could set the tone for the next several weeks of trading.
What Traders Should Watch
For short-term traders, the 1.3600-1.3610 zone is the immediate line in the sand. A daily close above this area would be a bullish signal, potentially triggering stop-losses and attracting fresh buying interest. Conversely, a failure to hold above the 1.3550 support level could invite sellers to test the 1.3500 round number and the 38.2% Fibonacci retracement near 1.3470.
Broader market sentiment and upcoming economic data releases, including UK GDP figures and US jobless claims, will likely provide the next directional impulse. Until then, the technical standoff at 1.3600 remains the dominant narrative for GBP/USD traders.
Conclusion
The 61.8% Fibonacci retracement near 1.3600 stands as the most significant technical barrier for GBP/USD in the current environment. The pair’s ability to overcome or respect this level will likely determine the next major directional move. Traders should monitor price action around this zone closely, as a breakout or rejection could carry meaningful implications for the broader trend.
FAQs
Q1: What is the 61.8% Fibonacci retracement level in forex trading?
The 61.8% Fibonacci retracement is a key technical level derived from the Fibonacci sequence, often used by traders to identify potential support or resistance zones during price corrections. It is considered a significant area where price may reverse or consolidate.
Q2: Why is the 1.3600 level important for GBP/USD?
The 1.3600 level is both a psychological round number and a technical confluence zone where the 61.8% Fibonacci retracement aligns. This makes it a strong resistance area that has historically attracted selling interest and capped upside moves.
Q3: What happens if GBP/USD breaks above 1.3600?
A sustained break above 1.3600 would likely signal a bullish continuation, with the next resistance targets near 1.3700 and potentially higher. It could also trigger a shift in market sentiment toward a more bullish outlook for the pound against the dollar.
This post GBP/USD Technical Outlook: 61.8% Fibonacci Retracement at 1.3600 Caps Upside first appeared on BitcoinWorld.


You May Also Like
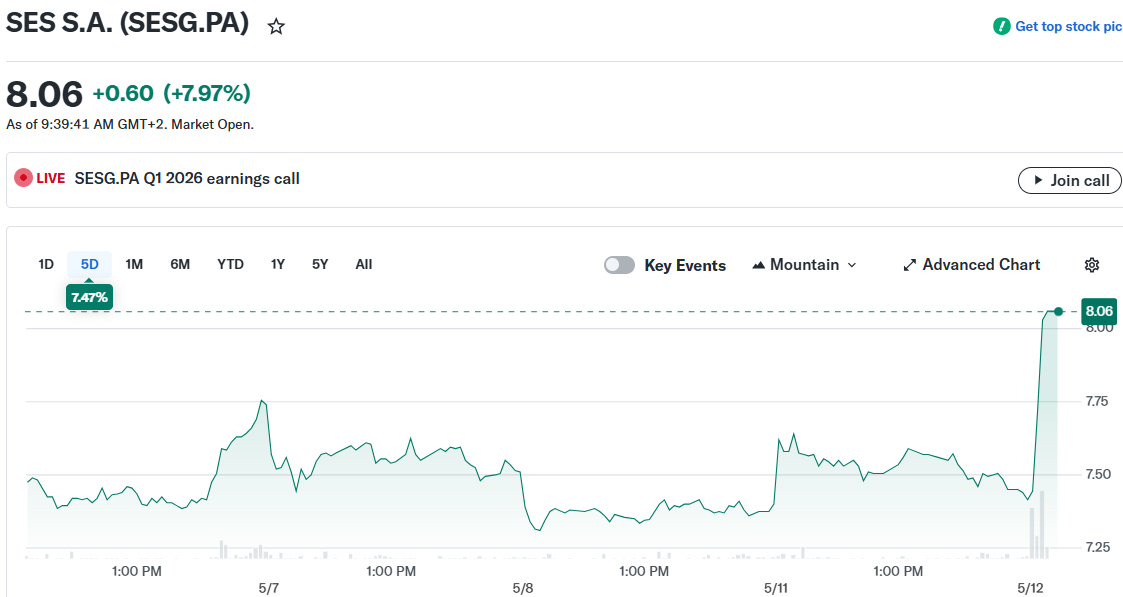
SES Reports 80% Revenue Jump as Aviation Connectivity and Intelsat Merger Drive Q1 Growth
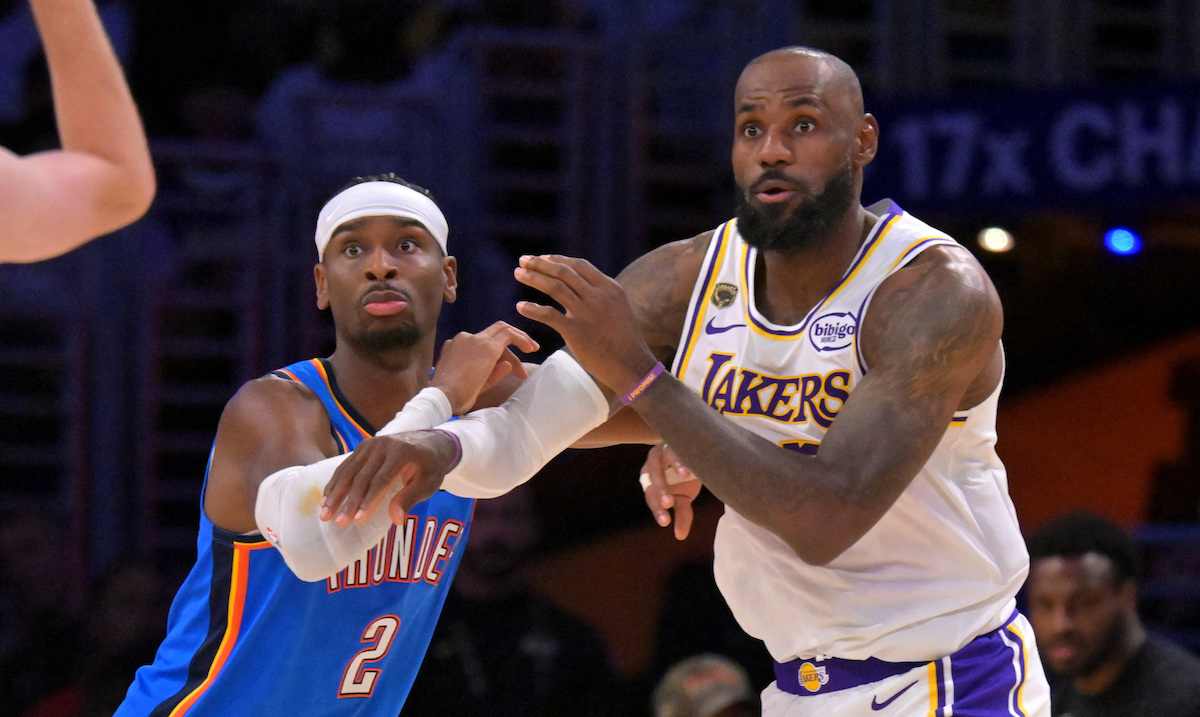
Shai Gilgeous-Alexander, Thunder still perfect in playoffs after sweep of Lakers


