

Ethereum Price Analysis: Bullish Structure Intact Despite Recent Decline
ETH holds corrective structure inside channel support as $2,187 and $2,318 define the next moves. Bullish setup still alive, per More Crypto Online.
ETH has been sliding. Not in a way that breaks things, but in a way that makes you watch.
Crypto analyst More Crypto Online, on X, flagged that Ethereum’s current pullback “appears corrective rather than impulsive.” The broader recovery structure, per that read, hasn’t topped. No confirmed signal yet.
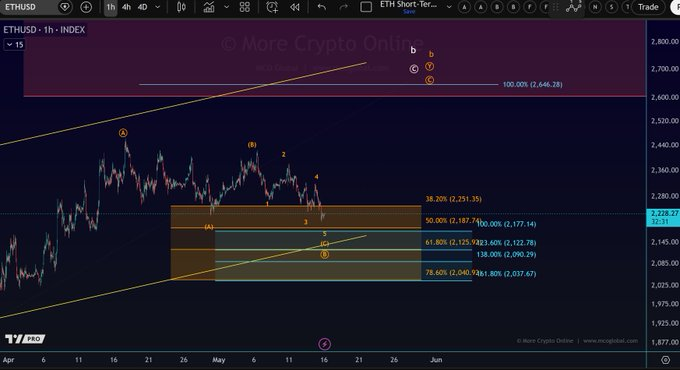
[The 1-hour ETHUSD chart from More Crypto Online showing the ascending channel, Fibonacci retracement levels (38.2% at $2,251, 50% at $2,187, 61.8% at $2,125), and labeled Elliott Wave counts (A), (B), (C) with resistance projection at $2,646]
When the Chart Says “Not Yet Dead”
ETH is still inside the channel. That’s the part that matters.
More Crypto Online outlined the leading scenario: as long as price holds within the current support zone and above the channel’s lower boundary, another leg up remains possible. The chart shows five Fibonacci levels stacked between $2,037 and $2,251, with the 50% retracement sitting near $2,177.
The analyst noted first support at $2,187, then $2,122 below that. The Ethereum price analysis picture has been tightening around this zone for days.
A bullish breakout above $2,318, per the same read, could open the path toward 2,646. That’s the 100% extension level visible on the chart. The Elliott Wave labels point to an unfinished corrective sequence, with the (C) leg still playing out.
Bears haven’t won this thing yet. The wave count on the chart labels the current drop as wave 3 inside a larger corrective (C), with wave 4 and potentially wave 5 still ahead before a directional resolution.
One Level That Changes Everything
A sustained break below the lower channel support changes the story entirely.
More Crypto Online, on X, said such a break would raise the probability that a more substantial top has already formed. Focus would then shift back toward the February lows. That’s the risk scenario, and it’s not priced in by most still holding long exposure.
The Fibonacci levels on the chart place the 78.6% retracement at $2,040, the last meaningful floor before that scenario becomes live. Ethereum’s DeFi TVL position has already been under pressure, which makes the technical picture harder to dismiss.
Three key support levels: $2,187, $2,122, $2,037. Two key resistance levels on the upside: $2,318 and $2,646. The asset is trading between them, and the next few sessions will likely force the issue.
ETH was hovering near $2,228 at the time of the analysis. Per the chart, price has been grinding inside the highlighted demand box, which spans roughly $2,090 to $2,250.
The market still lacks confirmation that the broader recovery has fully topped, as More Crypto Online put it. That’s not a bullish call. It’s the absence of a bearish one.
The post Ethereum Price Analysis: Bullish Structure Intact Despite Recent Decline appeared first on Live Bitcoin News.


You May Also Like

Iran’s foreign minister targeted in assassination attempt, wife killed

Why Binance Believes RWAs Are Crypto’s Next Trillion-Dollar Opportunity


