

Ford Stock Is Up 35% Over the Past Year. Here’s What the Q1 Beat Means for 2028
Key Stats for F Stock
- Past week’s performance: 1.3%
- 52-week range: $11 to $18
- Valuation model target price: $17
- Implied upside: +20.4% over 2.5 years
Estimate Ford’s fair value in under 60 seconds with TIKR’s free Guided Valuation Model >>>
A Beat, a Raised Outlook, and a Business Getting Off the Canvas
Ford Motor Company (F) reported first-quarter 2026 results on April 29, and the numbers surprised to the upside. Adjusted EBIT, which is operating profit before interest and taxes excluding one-time items, rose to $3.5 billion from $1.0 billion a year earlier. Revenue rose 6% to $43.3 billion, and Ford raised full-year adjusted EBIT guidance to $8.5 billion through $10.5 billion from $8.0 billion through $10.0 billion. The stock rallied on the news, but the full picture is more complex.
 Total Revenues (TIKR)
Tariffs were a major part of the Q1 beat. Ford booked a $1.3 billion one-time tariff benefit under the International Emergency Economic Powers Act, reflecting amounts paid between March 2025 and February 2026. CFO Sherry House was direct about the nuance, telling investors the earnings increase was not strictly because of the tariff reimbursement. The company has not yet received that refund, but is using it to offset an expected $1 billion incremental rise in aluminum costs.
Aluminum supply pressure has been a persistent headache. Novelis, a top supplier to Ford trucks, restarted its New York plant after fires disrupted production through the first half of the year. That disruption is now partially resolved. The experience still highlighted how dependent Ford’s F-Series business remains on a small number of suppliers, which explains why the LTM EBIT margin of just 0.8% lags far behind historical norms.
The EV unit, Ford Model e, posted a $777 million loss in Q1. That is improved slightly from the $849 million loss in Q1 2025, but it remains a drag on the consolidated margin picture. Ford Blue generated $1.9 billion of EBIT, and Ford Pro contributed $1.7 billion. Going forward, the Q2 report on July 27 will test whether the raised outlook is a floor or a ceiling.
See analysts’ growth forecasts and price targets for F (It’s free) >>>
Is F Stock Undervalued?
 F Guided Valuation Model (TIKR)
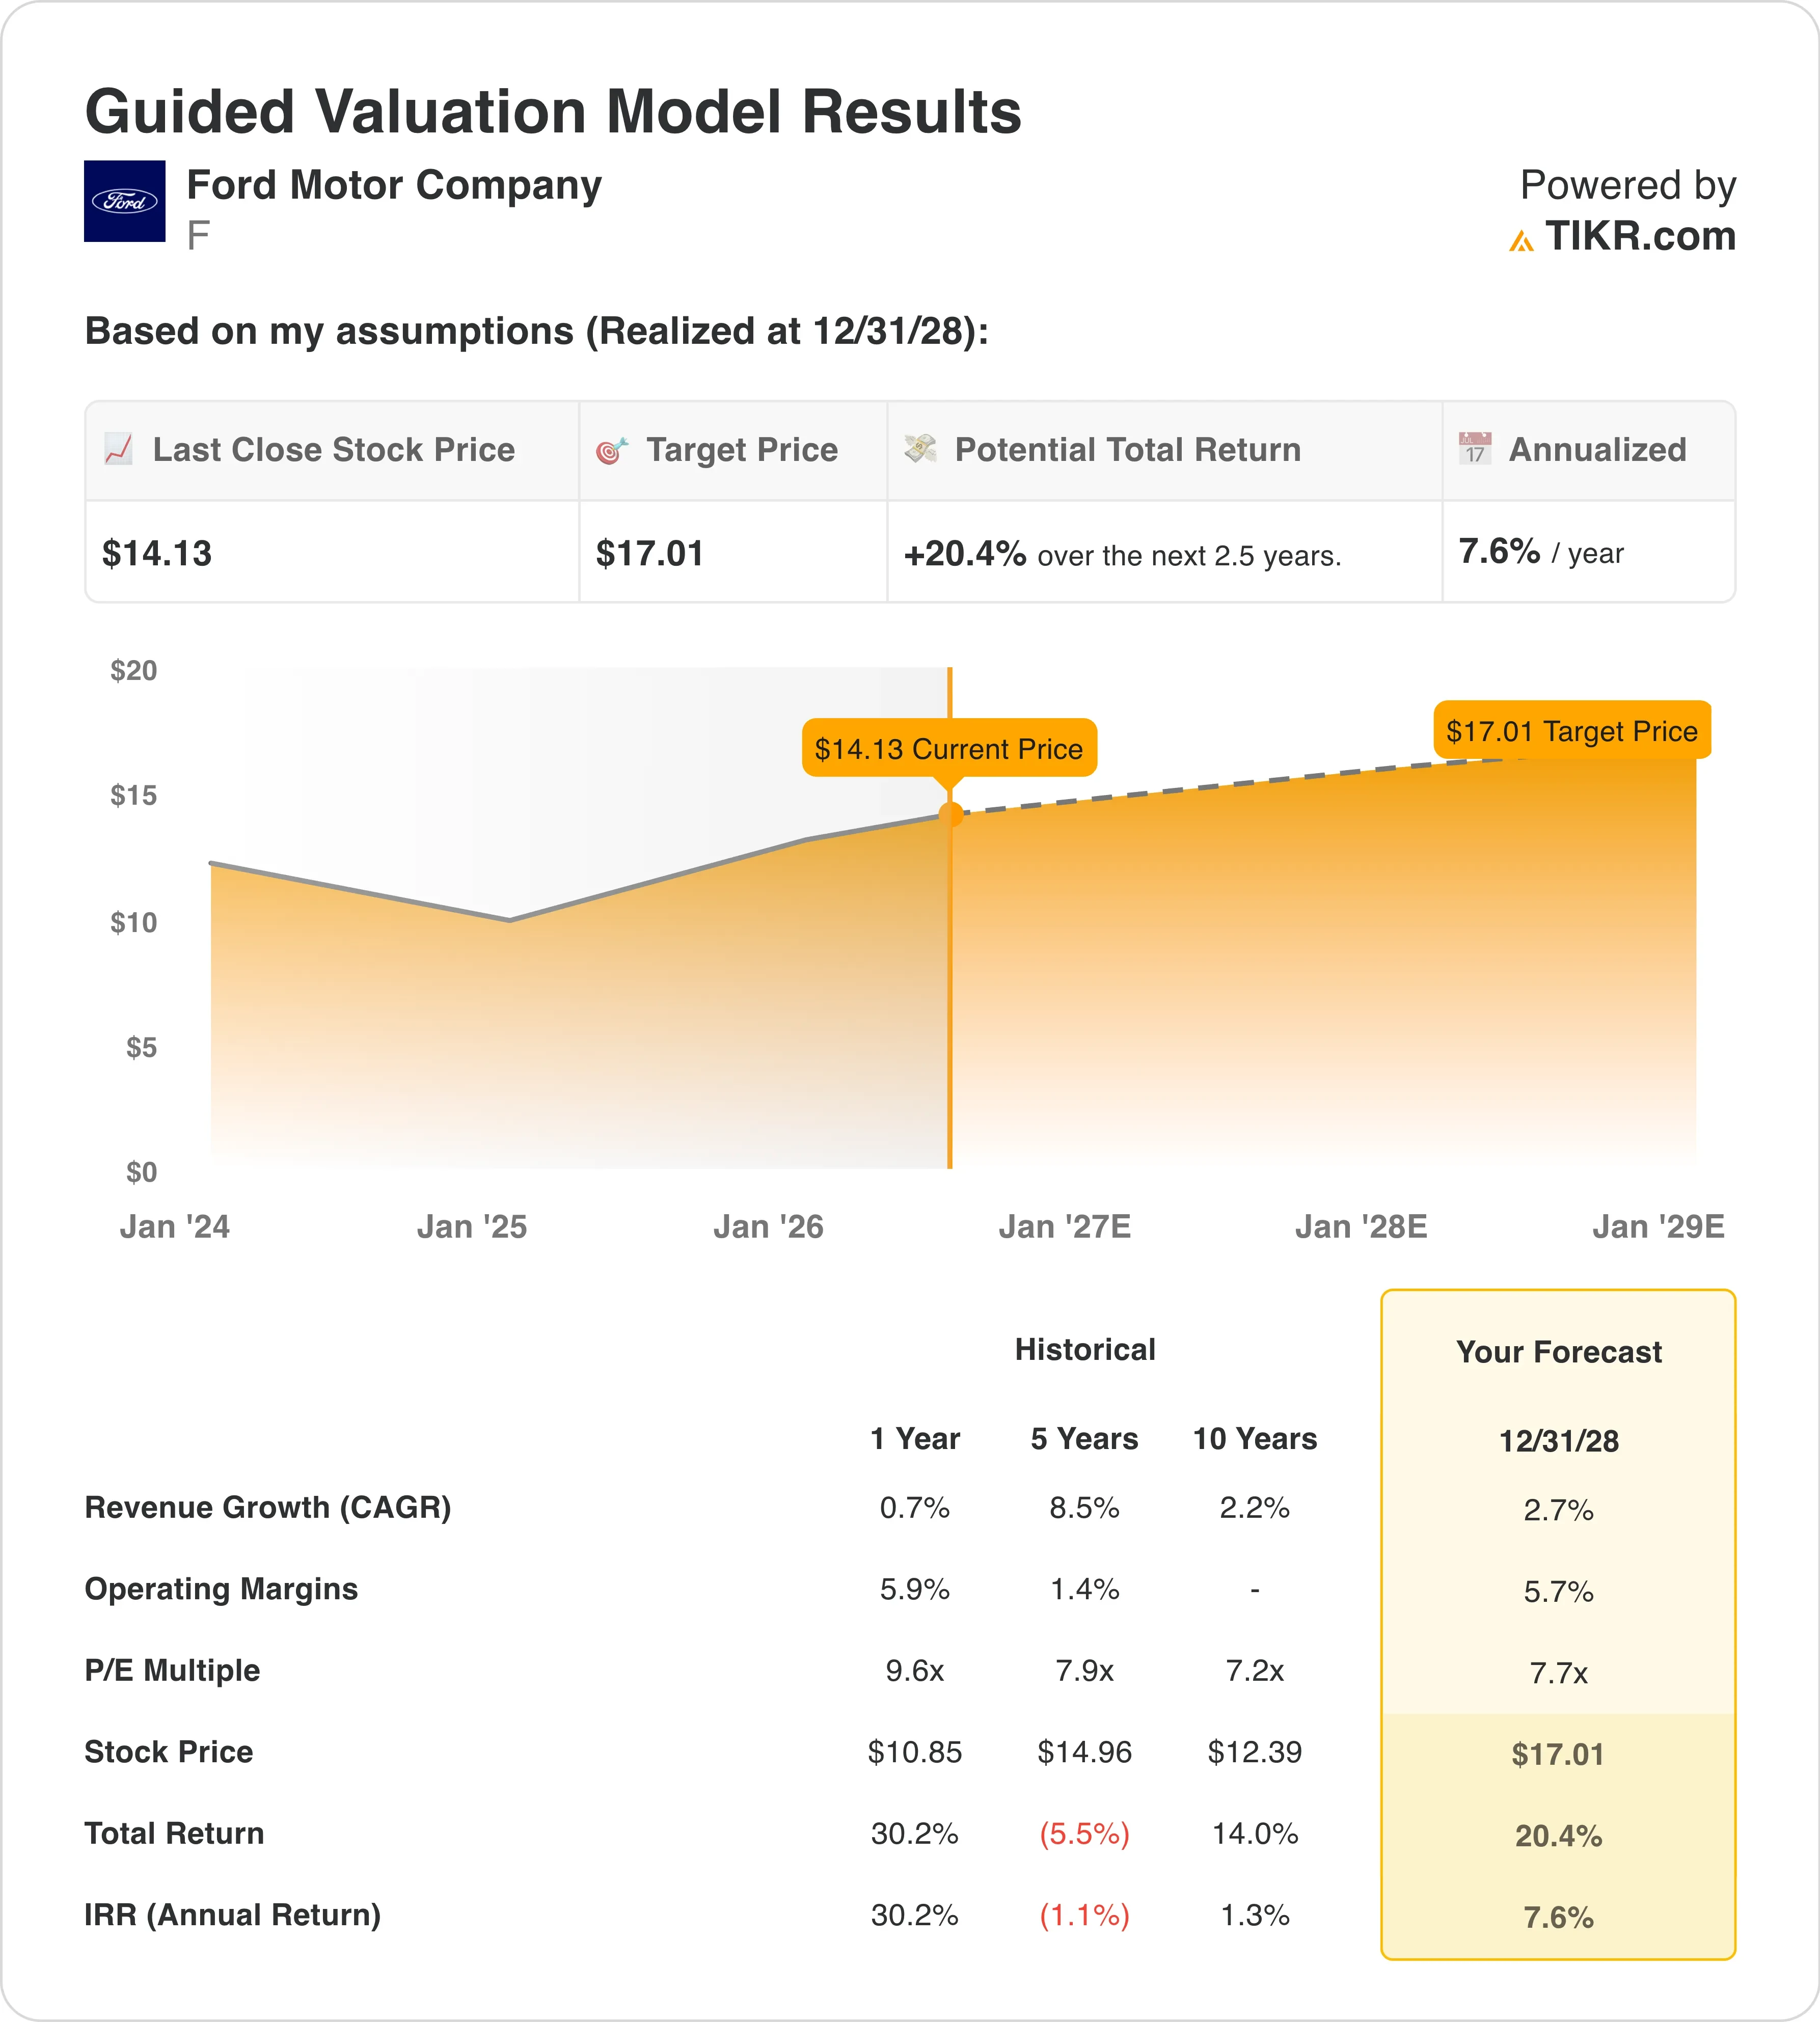
Under valuation model assumptions realized through 12/31/28, the stock is modeled using:
- Revenue Growth (CAGR): 2.7%
- Operating Margins: 5.7%
- Exit P/E Multiple: 7.7x
Based on these inputs, the model estimates a target price of $17, implying a 20.4% total return from the current share price of $14 and an annualized return of 7.6% over the next 2.5 years.
A 7.6% annualized return is market-rate, which means Ford at $14 is not obviously cheap or expensive. It is a stock that requires a catalyst to outperform, and the catalyst is sitting right in front of investors. Ford launched its energy storage business in May 2026, signing a five-year agreement with EDF Power Solutions for up to 20 GWh of battery storage systems. Morgan Stanley called the energy unit “underappreciated,” and the stock surged 13% on the news.
 F Guided Valuation Model (TIKR)
The operating margin assumption of 5.7% is where the story either holds or breaks. Ford’s LTM EBIT margin of 0.8% is well below that target. The gap represents the weight of EV losses, recall costs, and supply chain disruptions combined. If EV losses narrow and Ford Energy scales, the path to 5.7% margins is plausible, but it depends heavily on execution.
The revenue CAGR of 2.7% is modest by almost any standard. Ford posted May U.S. vehicle sales of 190,828 units, consistent with a market holding up despite tariff uncertainty. Hybrid sales in the U.S. are soaring, and Ford’s hybrid lineup remains a competitive strength.
Ford vs. General Motors and Stellantis
General Motors (GM) is Ford’s most direct domestic competitor. GM has been generating stronger EBIT margins from its internal combustion lineup and is further ahead in scaling its EV platform through Ultium. GM’s NTM P/E sits around 5x to 6x, modestly below Ford’s 9.6x. But GM’s EPS consensus for 2026 is more reliable because its EV losses are better contained.
 F NTM P/E vs. GTM vs. STLA (TIKR)
Stellantis (STLA) is the more cautionary tale. The maker of Jeep and Ram trucks has been struggling with pricing pressure and market share losses in North America. Its CEO recently vowed to stabilize cash flow after a quarterly miss, and the stock trades at a steeper discount than either Ford or GM. Ford’s commercial vehicle strength through Ford Pro is a genuine advantage versus Stellantis’s weaker commercial offerings.
The Canadian labor angle matters as well. Unifor began formal 2026 auto negotiations with Ford on June 23, starting the Detroit Three labor cycle. Labor costs represent a meaningful portion of Ford’s North American cost structure, so the outcome will shape 2027 margin assumptions. A contract similar to the 2023 UAW agreement would add cost but provide multi-year certainty.
See why Ford Pro’s $6.8 billion EBIT still hasn’t been fully priced in >>>
What’s Driving F Stock Going Forward?
The Q2 2026 earnings report, expected July 27, is the next critical data point. Investors will check whether the Q1 tariff reimbursement was a one-time event or whether the full-year estimate holds. They will also watch whether aluminum costs stabilize now that the Novelis plant is back online.
Ford Energy is the wildcard that the market may still be undervaluing. The EDF deal covers up to 20 GWh of battery storage systems over five years. Ottawa’s $464 million commitment to refit a shuttered Ford truck plant in Canada adds another dimension to the buildout. If Ford Energy demonstrates a path to profitability alongside the core auto business, investors may begin valuing it separately, which could unlock upside.
European strategy is also taking shape. Ford plans seven new European models by 2029, pushing directly against Chinese rivals including BYD. That expansion coincides with the EPA’s proposed delay in enforcing Biden-era pollution rules, giving Ford more time to manage its product mix. Each of these threads, the energy business and the European expansion, represents a potential catalyst if execution delivers results that the current 7.7x exit P/E does not yet reflect.
The Unifor labor talks are the wildcard that could cut the other way. Negotiations started June 22 with Ford as the lead target, and a difficult outcome could pressure margin assumptions heading into 2027. Management has stayed disciplined on cost, but a wage agreement above prior assumptions would directly hit the 5.7% margin target the valuation model depends on.
Estimate a company’s fair value instantly (Free with TIKR) >>>
Should You Invest in Ford Motor?
The only way to really know is to look at the numbers yourself. TIKR gives you free access to the same institutional-quality financial data that professional analysts use to answer exactly that question.
Pull up F, and you’ll see years of historical financials, what Wall Street analysts expect for revenue and earnings in the quarters ahead, how valuation multiples have moved over time, and whether price targets are trending up or down.
You can build a free watchlist to track F alongside every other stock on your radar. No credit card required. Just the data you need to decide for yourself.
Analyze F stock on TIKR Free→
Looking for New Opportunities?
- See what stocks billionaire investors are buying so you can follow the smart money.
- Analyze stocks in as little as 5 minutes with TIKR’s all-in-one, easy-to-use platform.
- The more rocks you overturn… the more opportunities you’ll uncover. Search 100K+ global stocks, global top investor holdings, and more with TIKR.
Disclaimer:
Please note that the articles on TIKR are not intended to serve as investment or financial advice from TIKR or our content team, nor are they recommendations to buy or sell any stocks. We create our content based on TIKR Terminal’s investment data and analysts’ estimates. Our analysis might not include recent company news or important updates. TIKR has no position in any stocks mentioned. Thank you for reading, and happy investing!


You May Also Like

StakeStone (STO) Rockets 125%: What $981M Trading Volume Reveals

Solana price confirms bearish crossover following Drift exploit, will it crash?


