

Robinhood Stock Stays Below 76–77 as Bears Keep Control

Robinhood Stock (HOOD) closed at 73.64 and remains capped below 76–77 resistance. Until that zone is reclaimed, bears retain the edge and the path of least resistance stays lower.
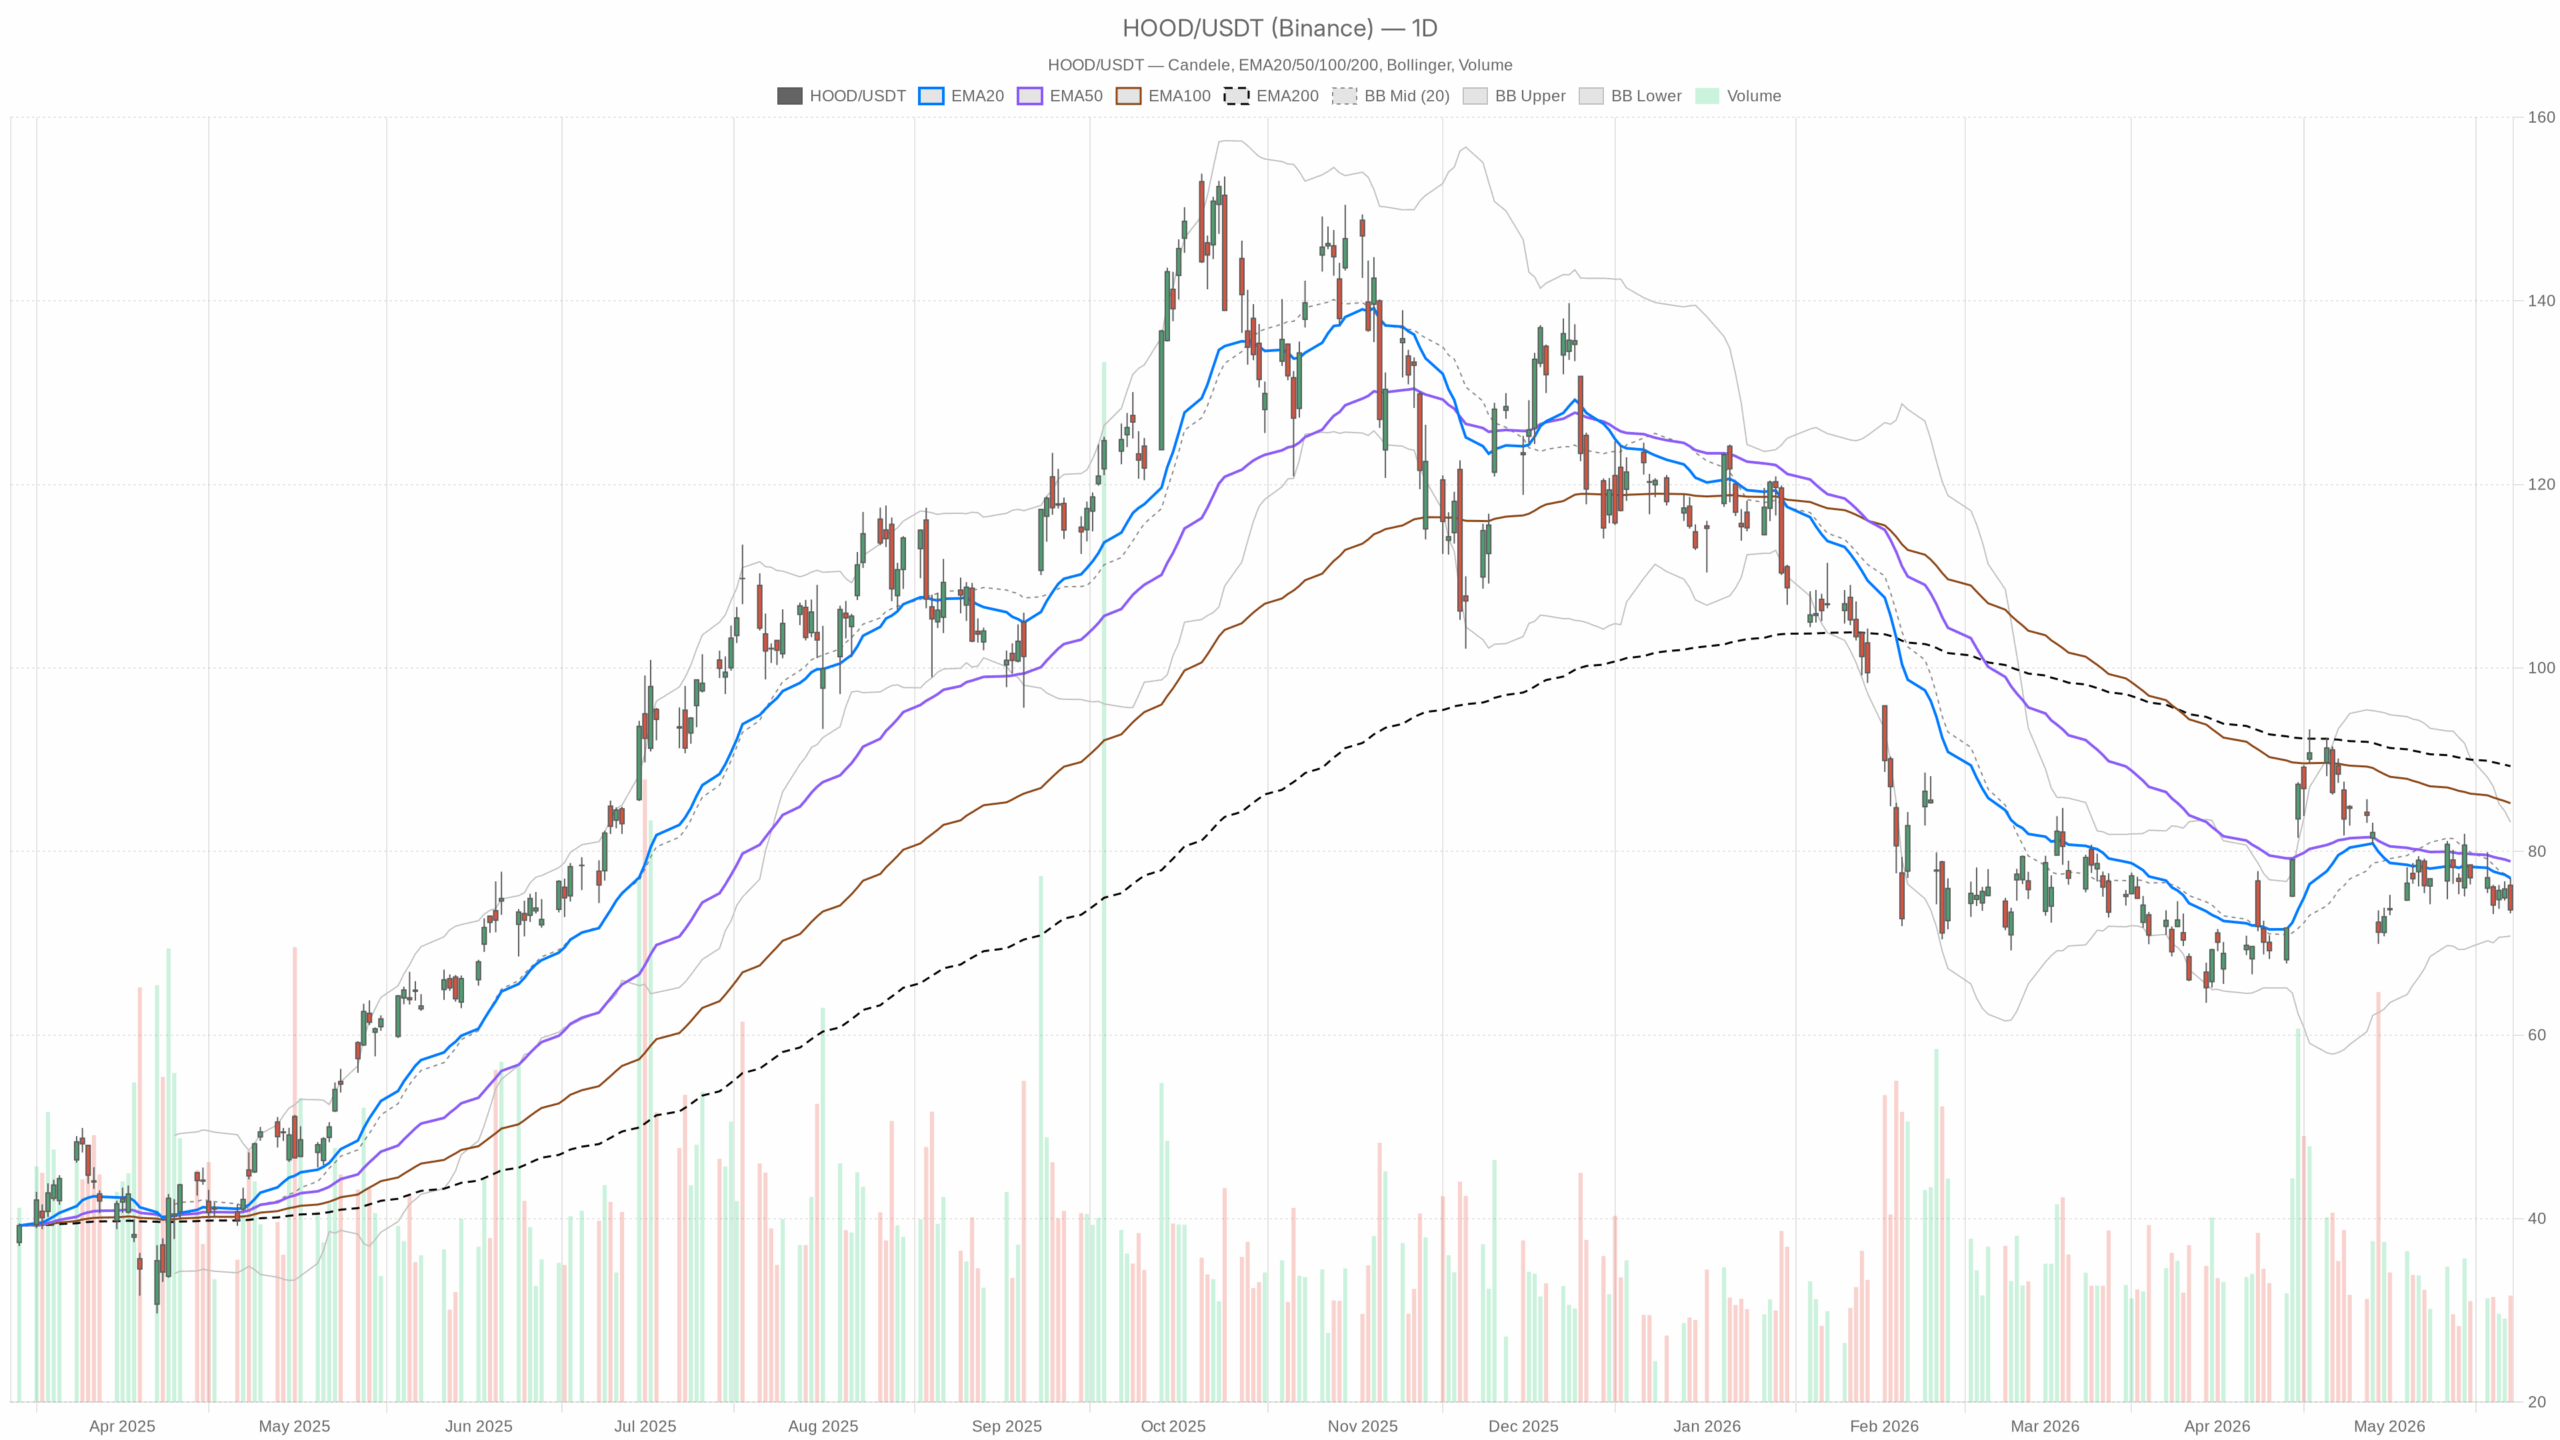 HOOD — daily chart with candlesticks, EMA20/EMA50 and volume.
Robinhood Stock Daily Trend: Sellers in Control Below Key Averages
Trend and Momentum
Price finished the week at 73.64, with supply active below 76–77. On the daily chart, HOOD sits beneath key moving averages: EMA20 77.11, EMA50 78.92, and EMA200 89.3. This alignment keeps trend control with sellers. RSI14 at 43.83 signals weak momentum without capitulation. That leaves room for further downside or only a tepid bounce. MACD line at -0.81 versus a -0.31 signal, with a -0.49 histogram, confirms negative momentum.
Levels and Volatility
The daily Bollinger mid near 77 and the lower band at 70.8 frame the range. Trading below the mid yet above the lower band implies pressure with some cushion before oversold extremes. Meanwhile, ATR14 3.84 indicates elevated daily swing potential. The daily pivot at 74.67, with R1 76.08 and S1 72.23, sets a tight ladder of reference points. Sitting below the pivot leans bearish into early sessions.
Intraday Setup: 1H Chart Confirms Bearish Bias in Robinhood Stock
On the 1H chart, EMA20 74.96, EMA50 75.82, and EMA200 76.81 cap price from above. This structure keeps bears in control intraday. RSI14 at 40.03 reflects soft demand, not capitulation. MACD at -0.55 versus a -0.42 signal, with a -0.13 histogram, shows downslope momentum with smaller impulse than earlier in the week.
The Bollinger mid at 75.17 and the lower band at 73.47 show price hugging the lower half of the band. That often translates to persistent selling pressure. At the same time, ATR14 1.11 points to moderate hourly volatility. The hourly pivot at 73.55, with R1 73.83 and S1 73.35, left price fractionally above the pivot into the close. That is a marginal positive but not trend‑changing.
Execution Window: 15‑Minute Chart Remains Fragile
In the execution window, EMA20 74.23, EMA50 74.77, and EMA200 75.85 sit overhead. This keeps short‑term rallies constrained. RSI14 at 37.93 shows weak momentum that is nearing, but not at, exhaustion.
MACD at -0.41 versus -0.34, with a -0.07 histogram, signals a bearish bias with limited follow‑through for now. The Bollinger mid at 74.25 and the lower band at 73.28 outline immediate support. Price holding just above the lower band often leads to small mean‑reversion bounces. Meanwhile, the pivot at 73.55, with R1 73.76 and S1 73.42, defines the micro‑battlefield. Hovering near the pivot underlines indecision despite the broader down‑bias.
Catalysts and Sentiment: Medium‑Term Tailwinds Need Validation
Notably, Robinhood’s planned role in a possible SpaceX IPO and pushes into AI‑driven features, social trading, and prediction markets expand reach. These initiatives broaden the top of funnel for engagement. For Robinhood Stock, those catalysts must be validated by price reclaiming key moving averages. Until then, sentiment remains cautious.
Bullish Scenario for Robinhood Stock: Reclaim and Repair
The bullish setup hinges on a base‑and‑reclaim sequence. A daily move back over the pivot at 74.67 would be step one. That would need quick continuation through 76.08 (daily R1) and the 77 zone aligning with the Bollinger mid and EMA20. A close above 77 would suggest momentum repair on the daily chart.
On 1H, a push above 74.96/75.82 (EMA20/EMA50), with RSI rising through 50 and a MACD bullish cross, would add confirmation. In that case, the upper daily band near 83.2 becomes the next upside magnet. The interpretation: strength above layered resistance signals buyers retaking control.
Bearish Case: Downside Levels and Invalidation
The bearish case stays primary while price rides below 76. A failure near 74, followed by a slip under 73.35–73.42 (1H/15m S1s), would reopen 72.23 (daily S1). Breaking 72.23 would expose the daily lower Bollinger near 70.8. With ATR14 3.84, that distance is feasible within a few sessions.
Invalidation requires a daily close back above 77 with traction above EMA20. The interpretation remains the same: holding below pivots keeps downside targets in play, while a close above 77 would negate that setup.
Robinhood Stock Outlook: Bias, Volatility, and Tactics
Overall, Robinhood Stock trades with a bearish lean across timeframes, though intraday momentum has cooled. Volatility is elevated, so levels can break and retest quickly. Therefore, until daily closes reclaim 76–77, the market will likely treat bounces as opportunities to reset shorts while respecting nearby supports for tactical reaction.


You May Also Like

EUR/GBP Exchange Rate Surges as Bank of England Rate Hike Expectations Intensify – Market Analysis

The Institutional Bitcoin Exit Is Real: Analyst Exposes Who’s On The Wrong Side Of The Trade

The Importance of Managing Employee Benefits Effectively



