

Ethereum News Today: ETH Holds $1,583 Above Key MAs and Base Formation Continues

Last Updated: June 28, 2026
Ethereum is trading at $1,583 on June 28, 2026 — up 0.06% — consolidating above MA(7) at $1,575 and MA(25) at $1,582 for the first time since the June selloff began. The 1H chart shows ETH has reclaimed both short-term moving averages and is approaching MA(99) at $1,591 — the last resistance before the $1,600–$1,611 zone. The $1,512 cycle low established on June 26 has now held across three consecutive sessions, and volume has dropped 85% from the June 26 capitulation peak — a classic post-capitulation base-building signature.
Key Takeaways
- ETH is at $1,583 on June 28, up 0.06%; 24H high $1,611, 24H low $1,562
- Price is above MA(7) at $1,575 and MA(25) at $1,582 — first bullish MA alignment since June correction began
- MA(99) at $1,591 is the next resistance; a close above it opens $1,600–$1,611
- Cycle low $1,512 (June 26) has held across three sessions — base formation in progress
- Fear & Greed Index at 18 (Extreme Fear) — cycle low; yesterday was 15, last week was 23
- BitMine now embedded in Russell 1000 with 5.67M ETH (4.7% supply); 86% staked — $233M projected annual revenue
- Glamsterdam upgrade targeting Q3 2026 mainnet: 78.6% gas fee reduction, 10,000 TPS
- Ethereum Foundation 40% spending cut confirmed — treasury sell pressure structurally reduced
Ethereum Price Metrics — June 28, 2026
| Metric | Value |
|---|---|
| ETH Price (current) | $1,583 |
| 24h Change | +0.06% |
| 24h High | $1,611 |
| 24h Low | $1,562 |
| Cycle Low (June 26) | $1,512 |
| MA(7) | $1,575 |
| MA(25) | $1,582 |
| MA(99) | $1,591 |
| Key Resistance | $1,591 (MA(99)) → $1,600–$1,611 |
| Key Support | $1,562 (24H low) → $1,512 (cycle low) |
| Market Cap | ~$191B |
| Circulating Supply | 120.68M ETH |
| ATH (Aug 24, 2025) | $4,951.66 |
| ATH Drawdown | ~68% |
ETH Reclaims MA(7) and MA(25) — First Bullish Signal Since June Selloff
The June 28 1H chart is the most constructive ETH technical setup since the correction began. Price at $1,583 sits above MA(7) at $1,575 and MA(25) at $1,582 — the first time ETH has held above both short-term moving averages simultaneously since the June 22–24 recovery attempt failed at $1,693. The MA structure is flattening: MA(7) is rising, MA(25) is rising, and MA(99) at $1,591 is the only remaining resistance within the $1,580–$1,600 range.
A sustained close above MA(99) at $1,591 would be the first confirmed bullish signal on the 1H chart in two weeks, opening the $1,600–$1,611 resistance zone. The 24H high of $1,611 is the immediate ceiling; a break above it would be the first higher high since the correction began and would shift the daily structure from bearish to neutral.
The volume picture confirms base-building rather than distribution: the June 26 capitulation session generated the highest volume of the correction, and each subsequent session has seen sharply declining volume — exactly the pattern seen at major cycle lows where sellers exhaust themselves on the capitulation day and subsequent sessions see decreasing participation.
Support and Resistance — June 28
| Level | Type |
|---|---|
| $1,611 | Resistance — 24H high / key breakout level |
| $1,600 | Resistance — psychological level |
| $1,591 | Resistance — MA(99) |
| $1,583 | Current price |
| $1,582 | Support — MA(25) |
| $1,575 | Support — MA(7) |
| $1,562 | Support — 24H low |
| $1,512 | Support — June 26 cycle low (structural floor) |
| $1,480–$1,500 | Support — next major demand zone |
Fear & Greed at 18: Sentiment vs Price Divergence
The Fear & Greed Index printed 18 on June 28 — down from 23 last week, 15 yesterday, 18 today. All four readings are in Extreme Fear, meaning crypto sentiment has been maximally compressed for at least 30 days. For Ethereum specifically, the divergence between sentiment (at cycle lows) and price (holding above the June 26 low for three sessions) is the most important signal to track.
When the Fear & Greed makes new lows while price holds above prior lows, that divergence historically resolves to the upside. ETH at $1,583 — above MA(7) and MA(25), three sessions above the $1,512 cycle low — while the index reads 18 is the clearest version of this divergence seen in the current cycle.
BitMine Russell 1000: Permanent Structural Demand Embedded
BitMine officially joined the Russell 1000 at market close on June 26 with 5.67 million ETH — 4.7% of all circulating supply. Of that, 4.88 million ETH (86%) is actively staked, generating a projected $233 million in annual staking revenue. Every passive index fund benchmarked against the $4+ trillion Russell 1000 now holds BMNR proportionally — embedding indirect ETH exposure across the broadest institutional equity benchmark in the world.
The structural significance is long-term and compounding: as BitMine’s staking revenue accumulates, the company has a financial incentive to continue holding and staking rather than selling. The 86% staking ratio means the effective liquid supply of ETH controlled by BitMine is less than 800,000 ETH — the rest is validator-locked and cannot be sold without an unstaking queue that takes days to weeks.
Glamsterdam Q3 2026: The Upgrade That Changes the Competitive Landscape
Ethereum’s Glamsterdam upgrade — targeting Q3 2026 mainnet — aims to cut gas fees by 78.6% and push throughput to 10,000 transactions per second. If delivered on schedule, Glamsterdam would be the single most significant technical development for Ethereum since The Merge in September 2022 and would meaningfully shift the competitive calculus between Ethereum, Solana, and BNB Chain for DeFi and stablecoin settlement activity.
The Q3 2026 timeline means testnet milestones should begin appearing in July and August — providing incremental positive catalysts for ETH price independent of macro conditions or CLARITY Act timing.
Ethereum Foundation Spending Cut: Sell Pressure Structurally Reduced
The Ethereum Foundation’s confirmed 40% spending cut removes a persistent source of structured selling pressure from the ETH market. Foundation treasury sales — historically a reliable overhead supply — have been a known headwind for ETH price through 2024–2026. The 40% reduction does not eliminate foundation selling, but it meaningfully reduces the predictable supply overhang that institutional traders model into their ETH positioning.
Combined with the EIP-1559 fee burn mechanism — which continues to remove ETH from circulation with every transaction — the spending cut tightens the net supply dynamic from both the issuance and the distribution sides simultaneously. For real-time ETH burn data, see Ultrasound.money.
Ethereum Price Comparison
| Asset | Price (June 28) | 24h |
|---|---|---|
| Bitcoin (BTC) | ~$60,251 | 0.00% |
| Ethereum (ETH) | $1,583 | +0.06% |
| XRP | ~$1.05 | –0.22% |
| Solana (SOL) | ~$71.66 | –0.01% |
| BNB | ~$556 | –1.32% |
| TRON (TRX) | ~$0.3215 | +0.27% |
Where to Buy Ethereum
Binance — deepest ETH/USDT liquidity globally. Bybit — spot and perpetual ETH pairs. Coinbase — US-regulated, ETH staking available on platform. Kraken — strong compliance record, ETH staking with competitive APY. KuCoin — broad ETH pair selection. Gate.io — wide token range. OKX — spot and futures ETH trading. Uniswap — leading decentralized exchange for ETH and ERC-20 tokens directly from self-custody.
FAQ
What is Ethereum’s price today, June 28, 2026?
Ethereum is trading at $1,583 on June 28, 2026, up 0.06% over 24 hours. The 24H range is $1,562–$1,611. Price has reclaimed MA(7) at $1,575 and MA(25) at $1,582 — the first bullish MA alignment on the 1H chart since the June correction began. MA(99) at $1,591 is the next resistance. The $1,512 cycle low from June 26 has held across three consecutive sessions, forming a potential technical base. A close above $1,591 opens $1,600–$1,611.
Why is the Fear & Greed Index at 18 and what does it mean for Ethereum?
The Fear & Greed Index at 18 (Extreme Fear) is the deepest reading of the current 2026 correction cycle — down from 23 last week and 15 yesterday. For Ethereum, the critical observation is the divergence between sentiment (at cycle lows) and price (holding above the $1,512 June 26 low for three sessions). When the Fear & Greed makes new lows while price holds, the divergence historically resolves to the upside. ETH’s reclaim of MA(7) and MA(25) on June 28 adds technical confirmation to this sentiment-vs-price divergence signal.
What is the BitMine Russell 1000 inclusion and why does it matter for ETH?
BitMine joined the Russell 1000 at market close on June 26 with 5.67 million ETH — 4.7% of all circulating supply. Every passive index fund tracking this $4+ trillion benchmark now holds BMNR proportionally. BitMine has staked 86% of its ETH (4.88 million ETH), generating a projected $233 million in annual staking revenue. The structural significance: 86% of BitMine’s ETH is validator-locked and cannot be sold quickly, permanently removing that supply from short-term market pressure while embedding indirect ETH demand into the world’s broadest passive equity benchmark.
What is the Glamsterdam upgrade?
Glamsterdam is Ethereum’s next major protocol upgrade, targeting Q3 2026 mainnet. It aims to cut gas fees by 78.6% and push throughput to 10,000 transactions per second — the most significant execution-layer improvement since The Merge. Testnet milestones are expected to begin appearing in July and August 2026, providing incremental positive catalysts for ETH price independent of macro or regulatory developments. Successful mainnet delivery would shift the competitive calculus between Ethereum, Solana, and BNB Chain for DeFi and stablecoin settlement activity.
What is Ethereum’s all-time high?
Ethereum’s all-time high is $4,951.66, reached on August 24, 2025. As of June 28, 2026, ETH trades approximately 68% below that record at $1,583. The 2026 cycle low is $1,512, printed intraday on June 26 — three sessions ago and not retested since.
You May Also Like

Report: Q2 2026 Becomes Worst Quarter Ever for Crypto Hacks
Supreme Court quietly doubling its police force — and 'loathes' acknowledging it: report
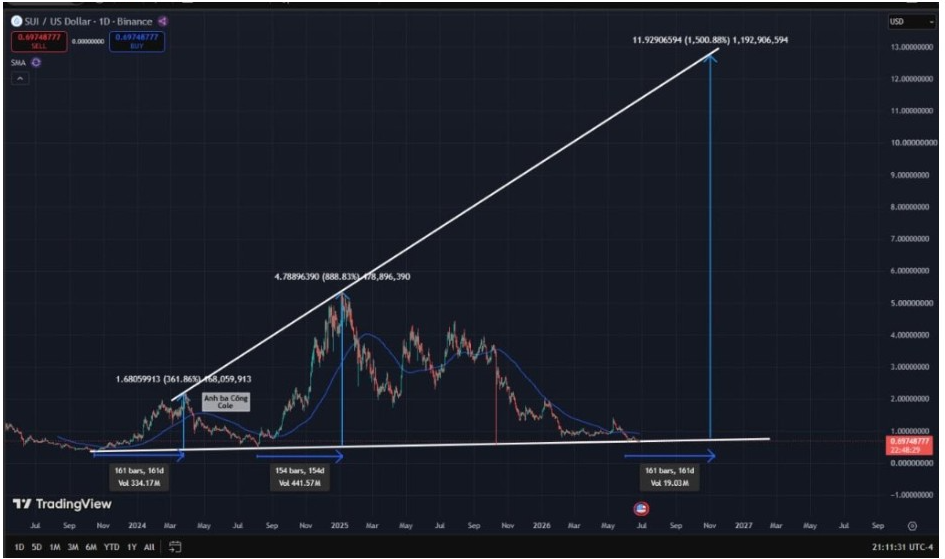
SUI Price Holds Near $0.70 as Analysts Target a Recovery Toward $0.84

