

How to Use Drawing Tools (Original K-Line)
Website
App
Popular Articles
View More
What is TON Coin? The Complete Guide to The Open Network Features, Tokenomics & Future
In the rapidly evolving landscape of blockchain technology, The Open Network (TON) emerges as a groundbreaking fifth-generation blockchain that promises to bridge the gap between cryptocurrency and

What is Blockchain? A Beginner's Guide to How It Works and Real-World Applications
In today's rapidly evolving digital landscape, blockchain technology has emerged as one of the most revolutionary innovations since the internet itself. This comprehensive guide will walk you through

TON Ecosystem Surge: MEXC Kicks Off Million-Dollar TON Giveaway For Summer Celebration
The blockchain world is once again shifting, and the TON ecosystem is rapidly emerging as a market focal point. With a surge in user growth, ecosystem expansion, and rising token value, every move

Hot Crypto Updates
View More
Gold Price Breaks $5,000! 2026 Gold Price Per Gram USD Analysis & Best Entry Points
Gold breaks historic $5,000/oz barrier in 2026! Comprehensive analysis of gold price per gram USD 2026 trends, technical targets at $5,200, and optimal entry strategies. Learn how to trade XAUT on

2026 Ultimate Guide to Gold Gifting: Which Offers Better Value—PAXG, XAUT, or Physical Gold Bars?
Discover why smart gifters in 2026 choose tokenized gold (PAXG, XAUT) over physical bars. Learn about fractional ownership, instant transfers, transparent verification, and why MEXC offers the best

How Much Is a Gram of Gold?
Gold Price Per Gram Today (10 November 2025) As of 10 November 2025, the price of gold per troy ounce is $3,997.45 USD. Since one troy ounce equals 31.1035 grams, the price per gram is approximately

Trending News
View More
Onco-Innovations Achieves Key Manufacturing Milestone for ONC010 Drug Candidate
Onco-Innovations completes 300-gram scale-up of A83B4C63 with 99.3% purity for ONC010 drug candidate, appoints Dave Antony as CFO. Learn about the PNKP inhibitor

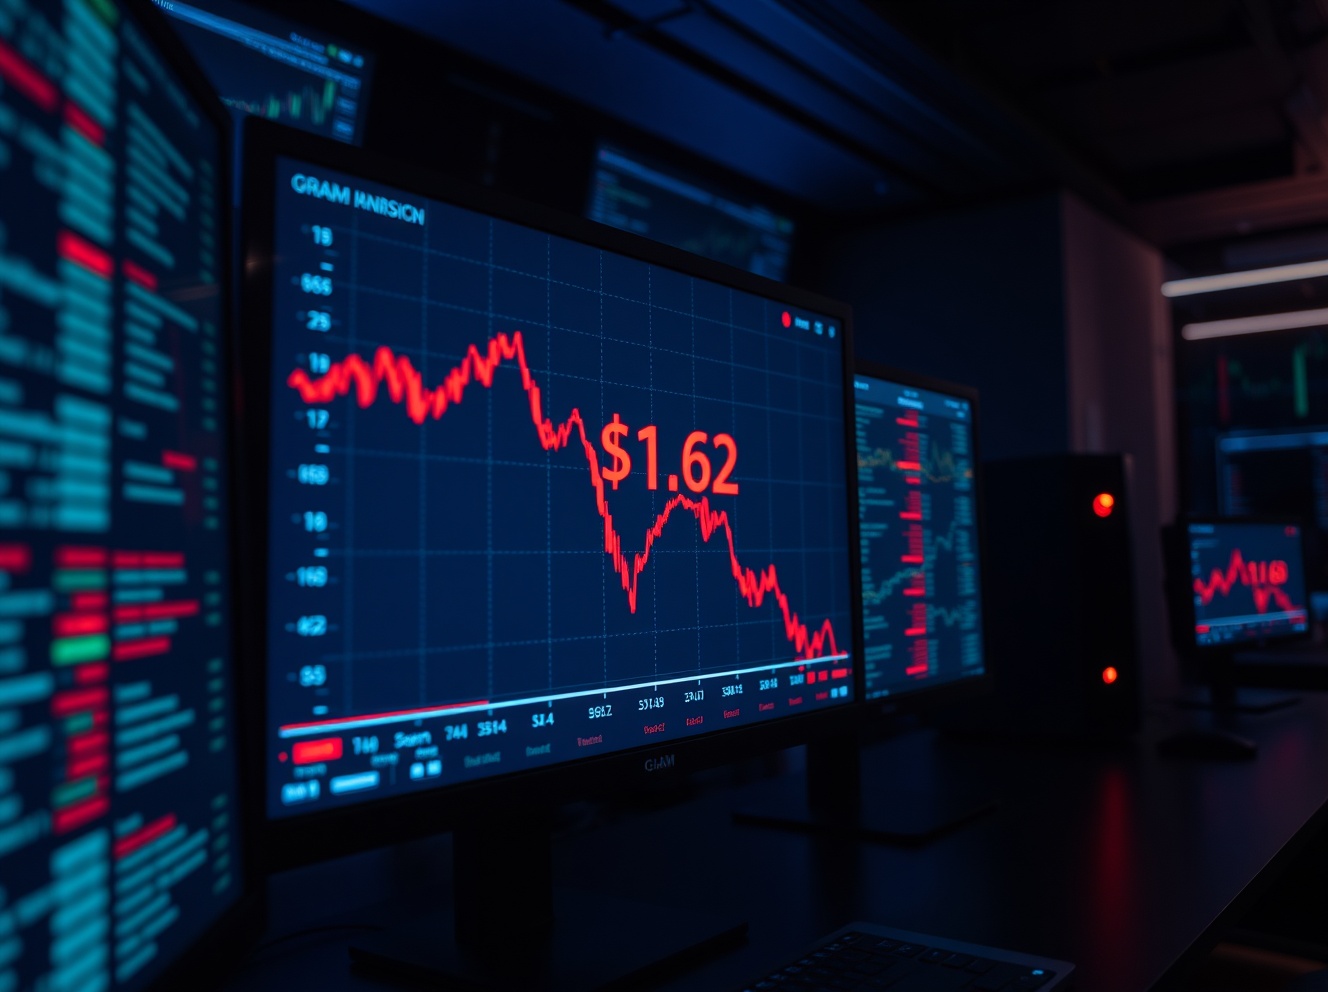
Robinhood Adds Spot GRAM Trading, Expanding Crypto Offerings for Retail Investors
BitcoinWorld Robinhood Adds Spot GRAM Trading, Expanding Crypto Offerings for Retail Investors Robinhood has announced the listing of spot GRAM, marking the latest
Related Articles
View More
How to Use TradingView on MEXC
TradingView is a powerful trading analysis tool that caters to users of all experience levels. MEXC has integrated TradingView's charting tools, allowing you to use them directly on the MEXC platform.

Analysis of Common Technical Indicators in the Cryptocurrency Market
In crypto trading, technical indicator analysis refers to a quantitative method that uses mathematical and statistical formulas to assess market trends. By processing price and volume data through spe

What Is the Stochastic Indicator (KDJ)?
The Stochastic Indicator (KDJ) is a technical analysis tool that analyzes price trends to assess market strength and identify overbought and oversold conditions, helping traders make buy and sell deci


