

Alibaba Stock battles 136 as daily trend stays under repair

Alibaba Stock (BABA) sits at a decision point. The daily trend remains bearish, yet price has stabilized around 135–136. For now, 136 is the battleground that will define the next leg, even as AI and cloud headlines build. The chart must still confirm.
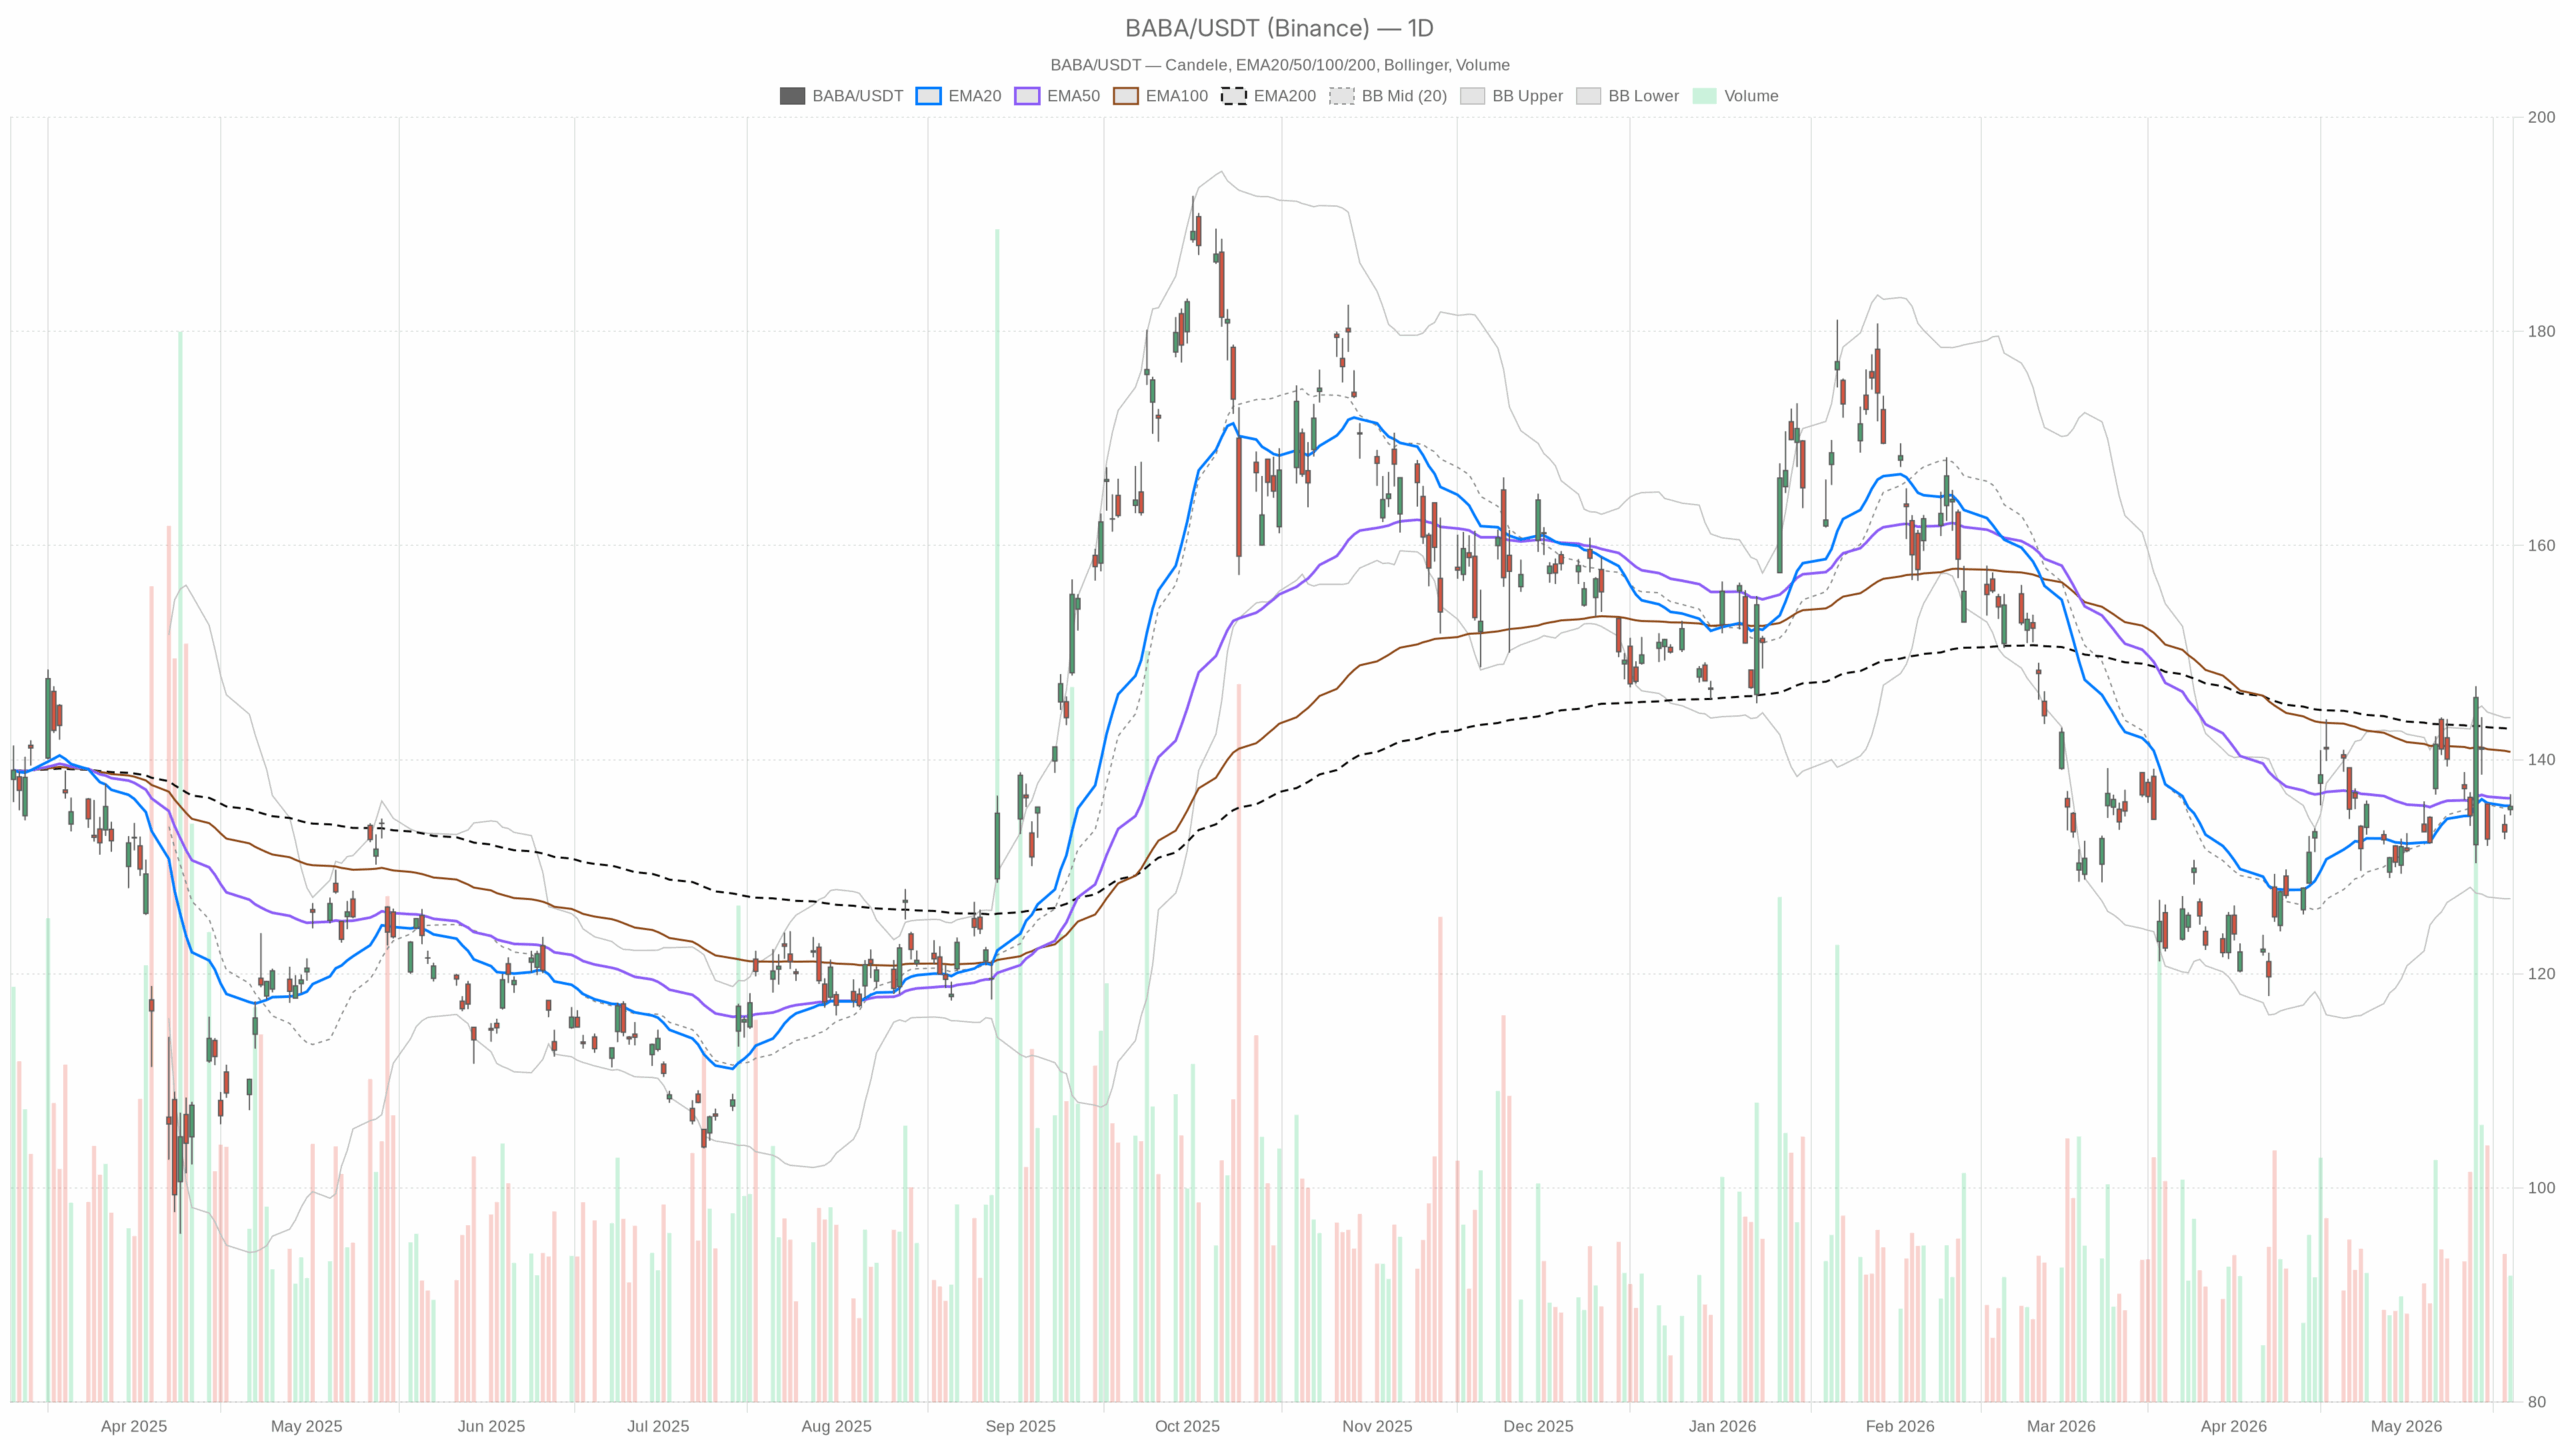 BABA — daily chart with candlesticks, EMA20/EMA50 and volume.
Alibaba Stock Technical Overview: Daily Trend Under Repair
Daily Price and Moving Averages
On the daily timeframe, BABA closed at 135.64. It sits fractionally below the 20-day EMA at 135.69 and below the 50-day EMA at 136.39. It also remains well under the 200-day EMA at 142.86.
Therefore, the primary trend is still under repair and buyers have not reclaimed trend control. The system’s daily regime flag is bearish. Read: the prevailing bias is caution until proven otherwise.
Momentum and Volatility Gauges
Meanwhile, daily RSI14 sits at 50.38. Read: momentum is balanced, not trending. Daily MACD shows a line of 1.03 versus a 1.28 signal and a -0.26 histogram. Read: momentum is soft and has not turned decisively higher.
Overall, Daily Bollinger Bands center on 135.48 with an upper band at 143.94 and a lower band at 127.03. Read: price is near the mean, leaving room in either direction. Daily ATR14 is 5.44. Read: expect wider day-to-day swings of roughly five to six dollars. Daily pivot is 135.74 with R1 at 136.68 and S1 at 134.70. Read: the market is hovering just under pivot and below nearby resistance.
Intraday Structure for Alibaba Stock
Meanwhile, the 1-hour chart is more constructive, but mixed. Price at 135.63 sits above the 20-EMA at 135.41 and the 200-EMA at 134.44, yet below the 50-EMA at 136.57. Read: an intraday bid is present, but overhead trend resistance remains close.
However, hourly RSI14 is 48.99. Read: momentum is neutral. The hourly MACD histogram is +0.43 with both line and signal below zero. Read: short-term momentum is improving from a weak base. Hourly Bollinger mid is 133.99 with an upper band at 136.41. Read: price is pressing the upper band, so resistance into 136 is active.
At the same time, hourly ATR14 is 1.15. Read: typical hourly swings are about a dollar. The hourly pivot is 135.48 with R1 at 136.01 and S1 at 135.11. Read: price is holding above pivot, but the 136 handle is the first ceiling.
At the same time, the 15-minute execution view shows a tactical bid. Price is above the 15m 20-EMA at 135.38 and 50-EMA at 135.16, but below the 200-EMA at 136.68. Read: the micro-trend favors buyers into a larger resistance cap.
Still, the 15m RSI14 is 55.77. Read: mild positive momentum. The 15m MACD histogram is -0.10. Read: near-term momentum is stalling under resistance. The 15m Bollinger mid is 135.61. Read: price is hugging the mean with a slight upside tilt. The 15m ATR14 is 0.37. Read: intraday noise is contained. The 15m pivot is 135.56 with R1 at 135.93. Read: above-pivot trade favors attempts at the 136 area.
AI and Cloud Catalysts for BABA
Notably, news flow has turned toward AI and cloud. Reuters highlighted Alibaba’s new AI chip effort, while other coverage debated valuation versus growth. Read: sentiment has a supportive catalyst, but conviction still needs a technical break.
Alibaba Stock Scenarios
Bullish Path
Therefore, the bullish scenario leans on a clean break and daily close above 136.68 (daily R1) and the 50-day EMA at 136.39. Read: that would mark a shift from repair to recovery. If achieved, the path opens toward the 140 area, then the 200-day EMA at 142.86 and the daily upper band near 143.94.
- Evidence to watch: the hourly MACD staying positive.
- Daily MACD histogram flipping to green.
- RSI pushing into the mid-50s.
Bearish Path and Invalidation
On the other hand, the bearish scenario resumes on a rejection near 136 followed by a slip below the hourly S1 at 135.11 and the daily S1 at 134.70. Read: failed rallies and lower lows reinstate pressure.
If selling extends, hourly mean reversion at 133.99 comes into view, with risk of a volatility-led slide toward the hourly lower band region and, in a larger downswing, the daily lower band at 127.03. Invalidation of the bullish case would be a daily close back under 134.70 with a weakening MACD and RSI sliding below 45.
Bottom Line: Range Respect Until 136–136.7 Breaks
Overall, Alibaba stock’s main bias is cautious-neutral on the daily chart, with the 1-hour offering a tentative tailwind and the 15-minute providing constructive but capped execution context. Positioning around 135–136 should stay tactical given a 5.44 daily ATR and nearby resistance. Until 136–136.7 gives way on a closing basis, respect both sides of the range and expect choppy follow-through.


You May Also Like

Home Depot (HD) Stock Tumbles to Two-Year Low Despite Beating Q1 Estimates

iplicit Launches AI-enabled Analytics and Reporting Suite as Centrepiece of Expanding AI Platform


