

BlackBerry Stock hits four-year high as overbought rally pauses

BlackBerry Stock exploded to a four-year high and closed at 7.91 after a two-day surge. The bias is bullish on a breakout with heavy volume. However, conditions are stretched, and the next move depends on whether buyers can consolidate above nearby pivots.
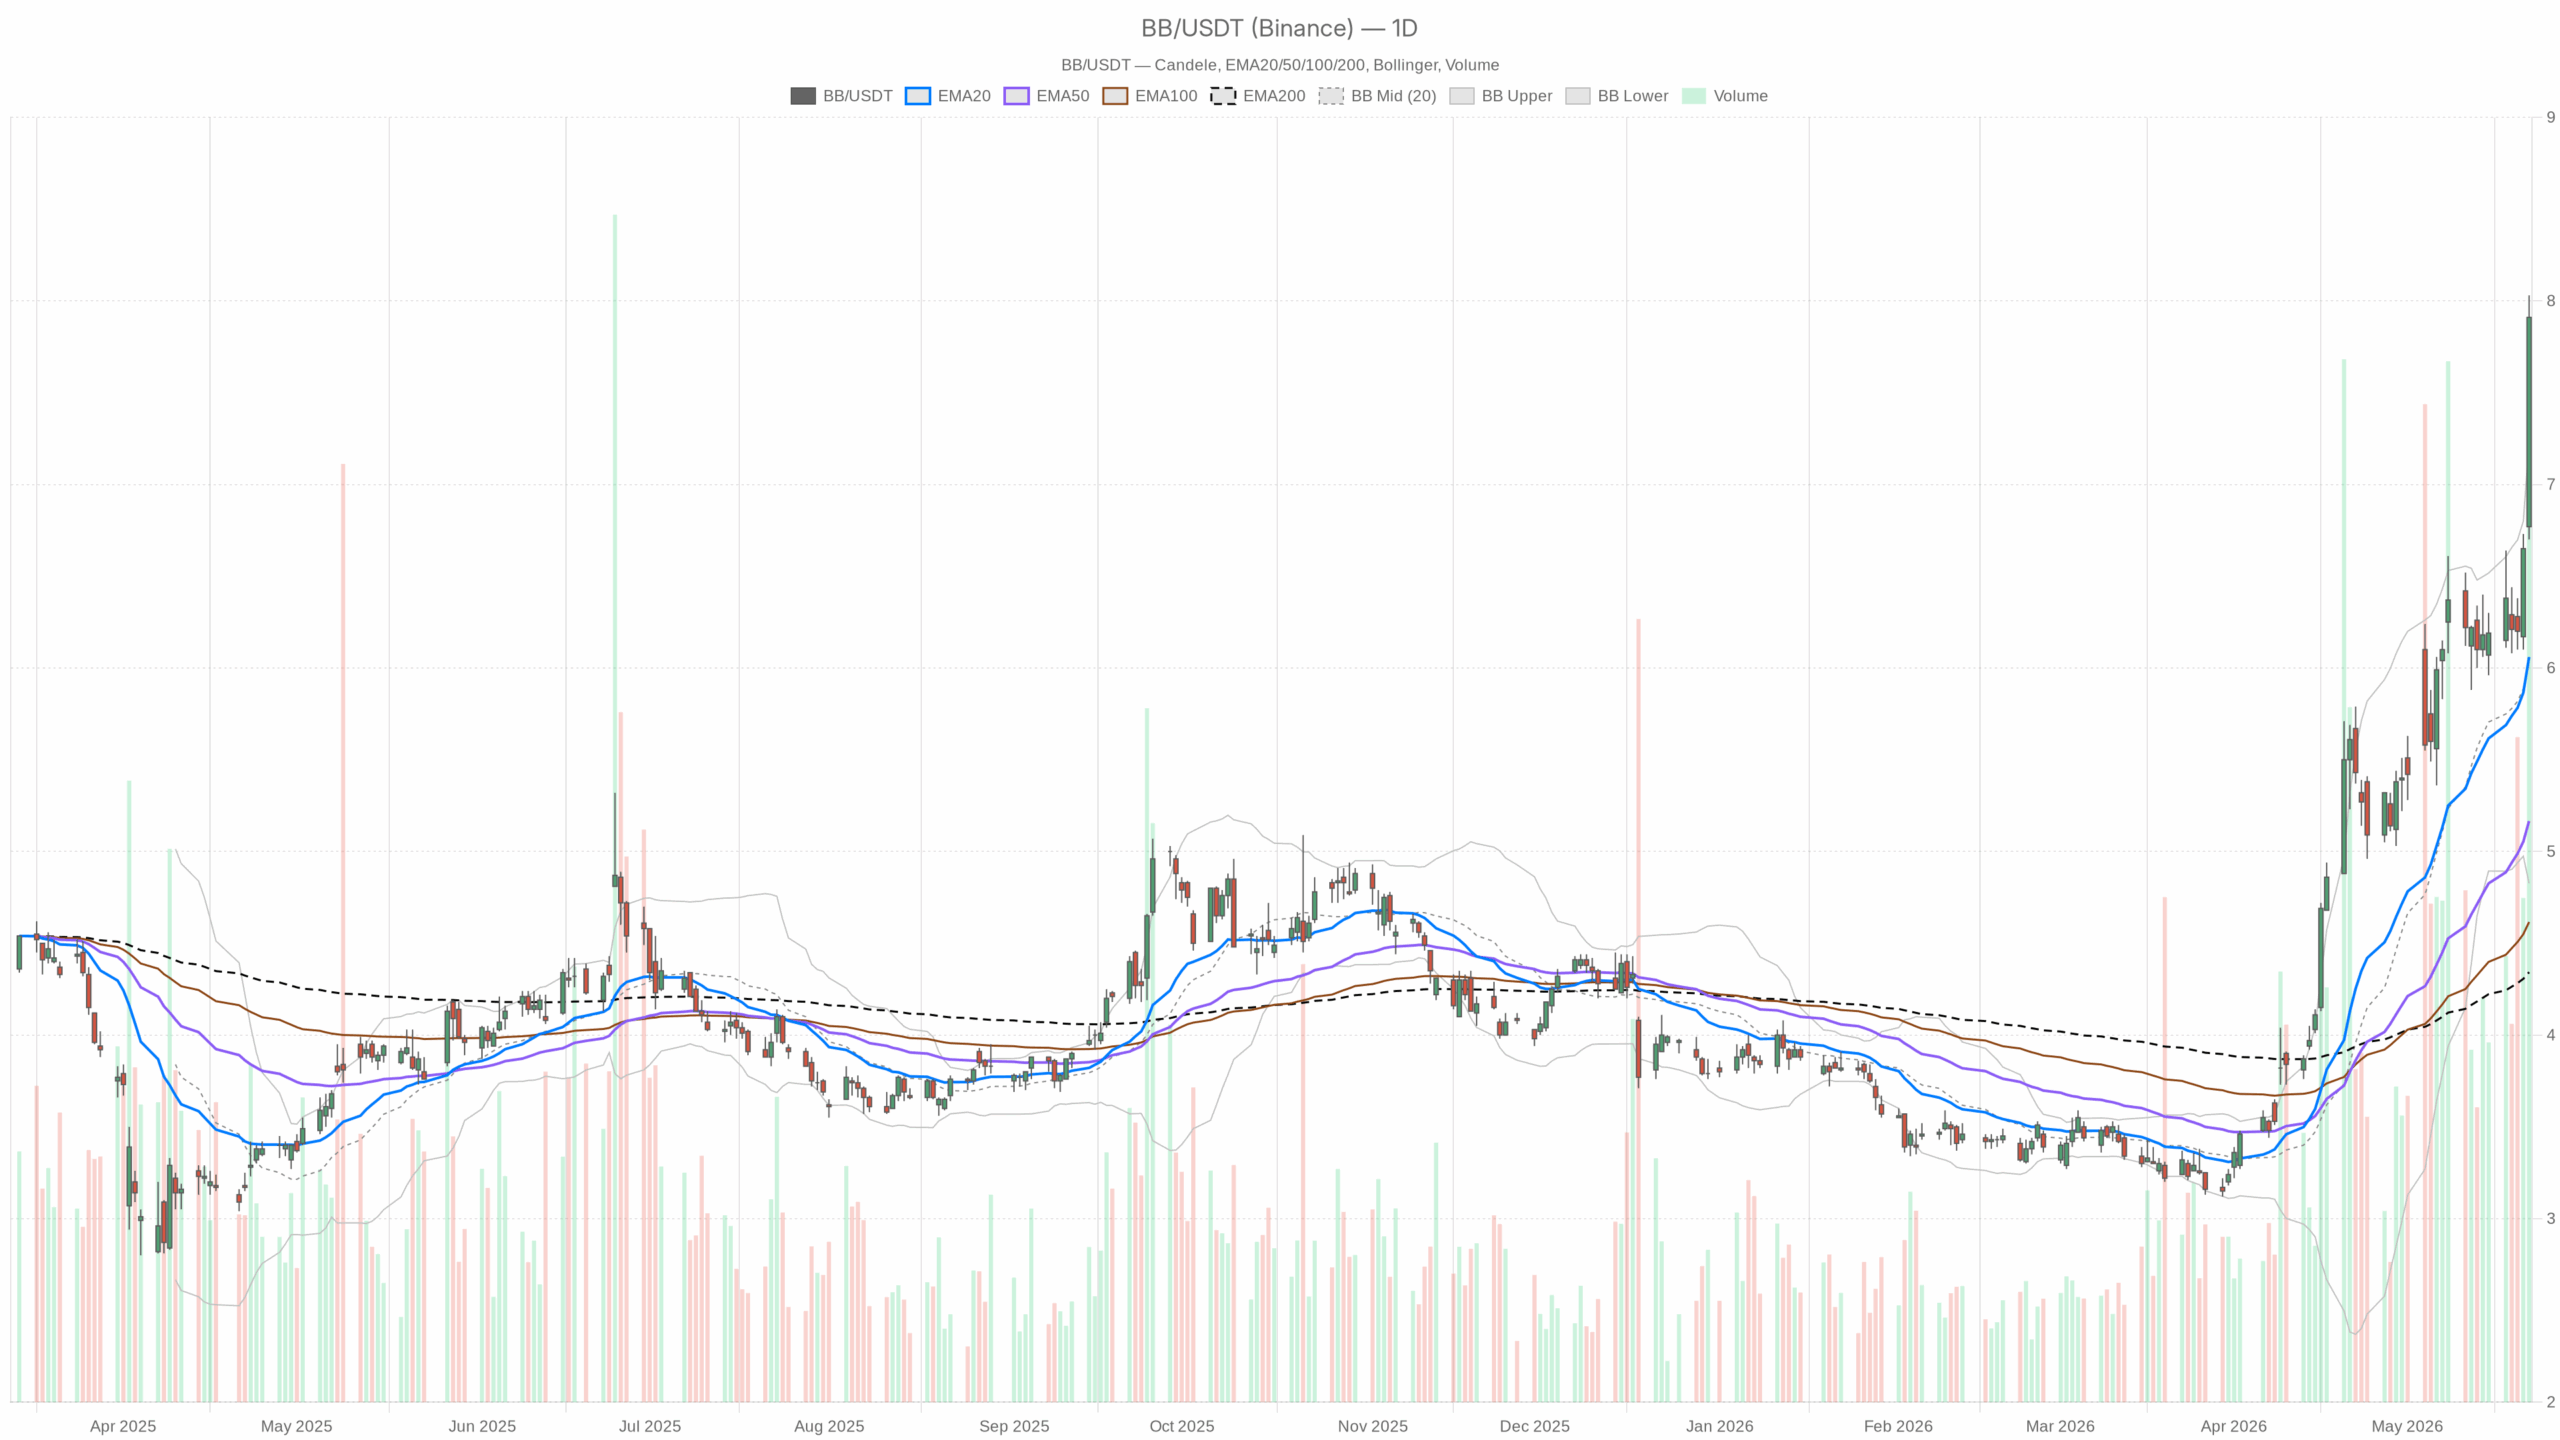 BB — daily chart with candlesticks, EMA20/EMA50 and volume.
Daily Technical Outlook for BlackBerry Stock
Trend and Momentum
The daily trend is firmly up. EMA20 6.06, EMA50 5.17, and EMA200 4.34 form a bullish stack that keeps trend control with buyers. RSI‑14 85.07 signals overbought conditions, so pullback or time-based digestion risk is elevated. MACD 0.60 vs 0.53 with a 0.07 histogram shows positive momentum, but the impulse is starting to cool.
Meanwhile, price closed near 7.91 while the Bollinger upper band sits at 7.23. Price is extended above the bands and prone to mean reversion. ATR‑14 0.49 indicates elevated volatility. Daily pivots: PP 7.55, R1 8.39, S1 7.06. Closing above PP keeps bulls in charge, with R1 as the next ceiling. Overall, the regime reads bullish, which favors buying dips over chasing strength.
Intraday 1H Structure: BlackBerry Stock Near Highs
On the 1H chart, the uptrend remains intact. EMA20 7.09, EMA50 6.64, and EMA200 5.70 are all rising, which signals strong intraday sponsorship. RSI‑14 80.54 is overbought, so momentum is strong yet vulnerable to a fade. MACD 0.43 over 0.29 with a 0.14 histogram confirms an expansion phase.
At the same time, the Bollinger mid is 6.86, the upper band is 8.23, and price sits near 7.90. Price is near, but not piercing, the band, which reduces immediate blow‑off risk. Hourly pivots cluster at PP 7.87, R1 7.94, and S1 7.84. Price hugging PP to R1 implies a tight bull flag coiling under resistance.
15-Minute Cooling Phase
On M15, short‑term momentum is cooling. RSI‑14 71.19 remains strong but no longer extreme. The MACD histogram −0.05 and a near cross with the signal reflect a pause. Still, EMA20 7.73 above EMA50 7.29 and EMA200 6.61 keeps the micro trend constructive. Bollinger mid is 7.82 with price near 7.90. M15 pivots sit at PP 7.87, R1 7.94, and S1 7.84; therefore, execution likely clusters around the 7.84–7.94 band.
Catalysts Behind the Move
In parallel, catalysts explain the surge. BlackBerry’s AtHoc platform received a high FedRAMP re‑certification, which underpins the security narrative and supported a two-day rally to a four-year high. A rotation toward automotive AI software also favored the name. However, a valuation piece flagged overvaluation risks after sharp gains, which could cap follow‑through if momentum fades.
Bullish Scenario Above Key Pivots
Therefore, the bullish path is continuation via consolidation above 7.55, then a push through 7.94 toward the daily R1 at 8.39. That outcome would be aided by hourly RSI cooling without price damage, a constructive MACD, and healthy volume on upswings. Holding above the H1 EMA20 at 7.09 keeps trend mechanics intact.
Downside Risks if Levels Fail
On the other hand, the bullish case weakens if price loses the 7.87–7.84 intraday pivot area and then the daily PP at 7.55. A sustained rejection below 7.55 would raise risk of mean reversion toward 7.06 (daily S1). If selling accelerates, a deeper reset toward the daily EMA20 at 6.06 becomes a tail‑risk, given how far price is above the bands.
Outlook for BlackBerry Stock
Overall, BlackBerry Stock (BB) holds a clear bullish bias on the daily chart, confirmed by the hourly tape, but it is tactically overbought. Expect higher two‑way volatility near term, with trades clustering around 7.84–7.94 until a break. Meanwhile, positioning near highs favors patience and disciplined use of the pivot levels as news‑driven gains are digested.


You May Also Like

Rubio presidency would be an 'unmitigated disaster': conservative insider

DBP Q1 income up 26%

Analyst: XRP Will Rise to $7.49 By June 22 and Down to $5.60 July 20. Here’s how and why



