-
Stellar (XLM) price continued surging for the third consecutive day, marking an intraday high of $0.299 with a significant rise in volume
-
Despite the impressive recovery, Stellar remains within a broader corrective structure, suggesting the rally may be transitioning into a consolidation phase.
Stellar (XLM) is outperforming the crypto markets, posting an 80% move in a short time and a mammoth rise in trading volume. The token also outperformed Bitcoin (BTC), leading by a staggering 33.7% in indexed performance over the past 2 days. Moreover, the XLM price, recording yet another 22.85% jump in the past 24 hours, stands in stark contrast to Bitcoin’s decline, highlighting a clear and strong divergence in short-term market dynamics.
The market capitalisation surged over $8.45 billion, suggesting the capital is currently flowing aggressively into specific altcoins like Stellar. The surge, followed by the recent announcement of the DTCC & Stellar’s collaboration, has raised optimism among the market participants. The price is currently correcting from the intraday high, just below $0.30. Considering the historical charts, the XLM price has just begun to rise and may continue to do so until it reaches new highs.
.
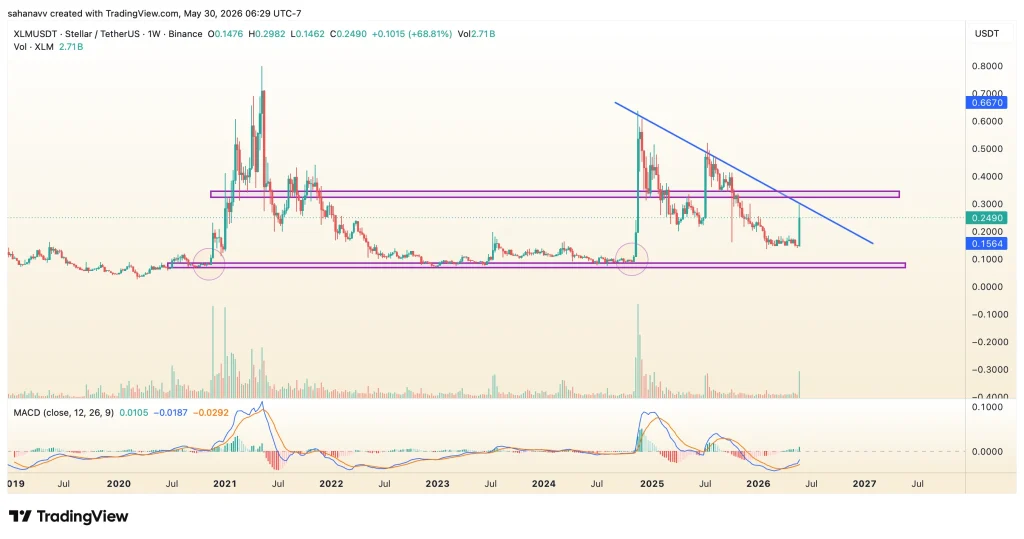
XLM remains trapped below a long-term descending trendline that has capped every major rally since early 2025. The $0.33-$0.35 zone continues to act as a critical resistance area, while the recent rebound from the accumulation base confirms that buyers remain active at lower levels. The MACD indicator is also showing signs of recovery after a prolonged bearish crossover, with the histogram turning positive.
Key Levels to Monitor Now are
- Immediate Support: $0.15-$0.16
- Major Resistance Zone: $0.33-$0.35
- Trendline Resistance: Near $0.30-$0.33
- Bullish Breakout Confirmation: Above $0.35
- Long-Term Upside Target: $0.50-$0.67
- Bearish Invalidation: Below $0.15
Considering the previous rallies, the XLM price has broken after a prolonged accumulation. The MACD also largely remained within the bullish range whenever the price triggered a bull run. Currently, the levels have initiated a parabolic recovery, and once it enters the positive range, a strong bull run could push the price to new highs.