

XRP (XRP) Hits Rare Oversold Level Not Seen in Over a Decade—What Comes Next?
Key Takeaways
- XRP approaches a rare death cross formation between the 20-week and 200-week exponential moving averages around $1.39–$1.40
- Historical death cross patterns resulted in price rebounds ranging from 20% to 82.7%
- Approximately $236.5 million in short liquidations are concentrated in the $1.37–$1.40 price range
- Market analyst Cryptollica notes XRP has reached this oversold level just three times across 13 years
- Cycle-based forecasting models from EGRAG CRYPTO and CW point to potential targets spanning $5.70 to $8.00
As of June 23, 2026, XRP is hovering around $1.13–$1.14, marking a decline from its recent peaks. However, a convergence of technical indicators suggests the cryptocurrency may be positioned for a short-term recovery rally approaching 25%.
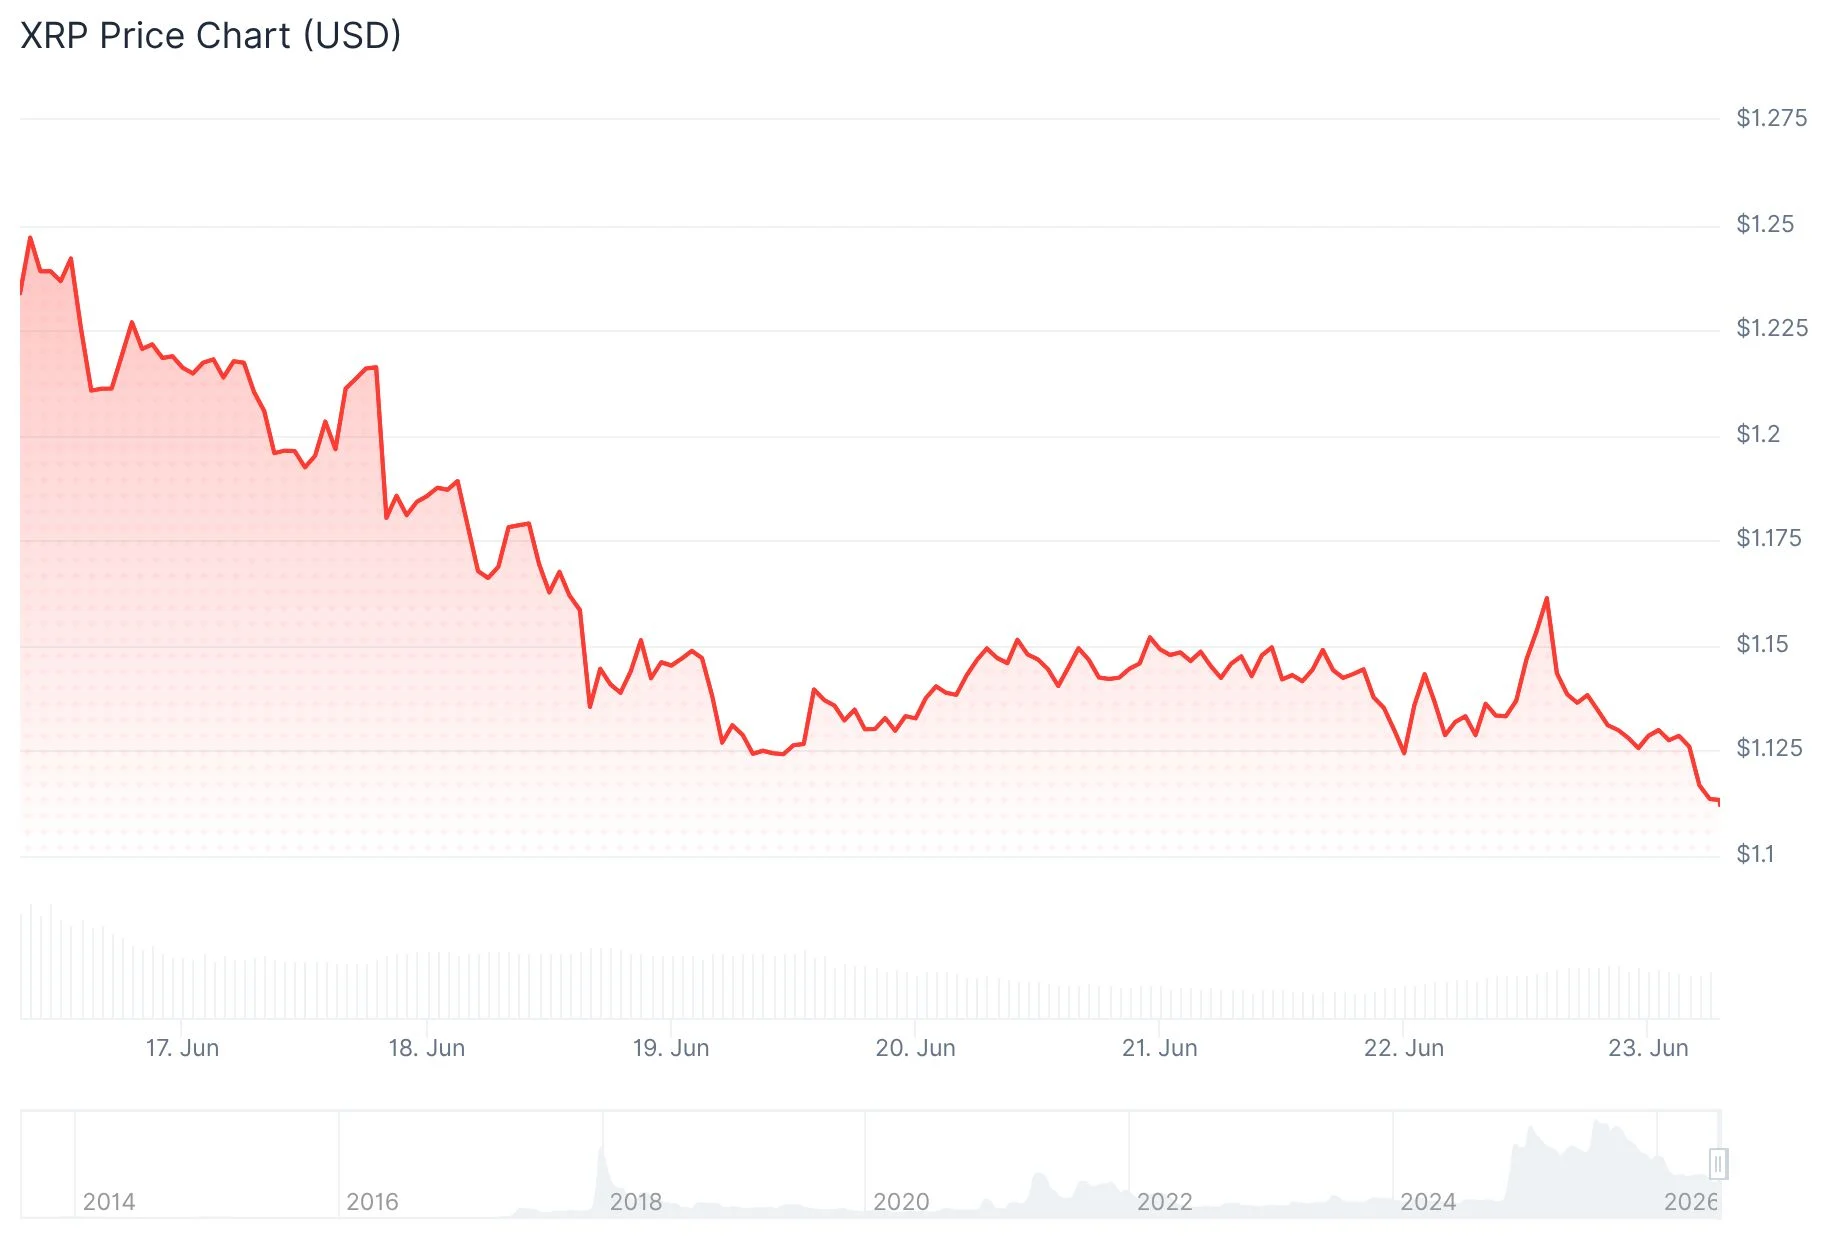 XRP Price
The 20-week exponential moving average for XRP currently hovers just above the 200-week EMA, positioned near $1.39 and $1.40 respectively. Should the shorter-term average drop beneath the longer-term one following a weekly close, it would create an uncommon death cross formation.
While this technical pattern typically carries bearish connotations, XRP’s historical performance following such crossovers tells a different story. Previous instances have triggered mean-reversion rallies back toward the longer-term moving average.
During 2019, XRP experienced approximately a 20% surge following a comparable formation. The 2022 occurrence proved even more dramatic, delivering an 82.7% rally. In both situations, the 200-week EMA served as a price magnet.
If history repeats itself, XRP could target the $1.39–$1.40 range—representing a potential upside of 23% to 25% from present levels.
The weekly Relative Strength Index for XRP currently registers just above 30, a level traditionally associated with oversold market conditions. Such readings typically indicate that downward momentum may be exhausting itself.
Concentrated Short Position Liquidation Risk Near $1.40
Data from CoinGlass liquidation heatmaps reveals a substantial $236.5 million concentration of short position liquidations positioned in the $1.37–$1.40 price corridor above current trading levels.
Should XRP initiate an upward move, traders holding short positions in this zone would face forced buybacks of their positions. This forced buying activity could provide additional momentum driving price action toward $1.40.
On Sunday, analyst Cryptollica highlighted that XRP’s 10-day RSI has dropped into the low-30s range, approaching levels historically correlated with significant accumulation periods during previous market cycles.
“In 13 years, XRP has only been this washed out 3 times,” Cryptollica stated. “The first 2 times, the crowd laughed, ignored it, and only understood the setup after price had already left.”
Cryptollica’s technical analysis also illustrates XRP maintaining position above the lower boundary of a multi-year ascending channel that has connected significant macro bottoms dating back to 2017. This support trendline is currently situated near $0.75.
Large Holder Activity and Extended Time Frame Projections
Analyst EGRAG CRYPTO employs a cyclical analysis framework centered on a “Central Line”—representing a macro equilibrium threshold that distinguishes accumulation phases from expansion phases.
Drawing from historical growth cycles that have produced returns between 200% and 330% above this equilibrium line, the analytical model suggests a best-case price objective of $8.00, with a more conservative cycle target of $5.70.
Independently, analyst CW noted increasing divergence between whale wallet behavior and retail market participants, observing that major holders have been expanding long positions in XRP derivatives.
Analyst Javon Marks emphasized that each significant momentum trough throughout XRP’s trading history has subsequently produced gains exceeding 10x, suggesting a potential target above $15 is within reach. He characterized the present setup as aligning with a broader historical pattern of gains surpassing 1,000% from comparable bottom formations.
XRP’s 24-hour trading volume currently registers at $1.45 billion, supporting a market capitalization of $70.99 billion. The asset has posted a 6.02% gain over the past 24 hours.
The post XRP (XRP) Hits Rare Oversold Level Not Seen in Over a Decade—What Comes Next? appeared first on Blockonomi.


You May Also Like

Ledger CTO Ties $280M Drift Hack to North Korea Suspects

From Telegram to Terminal: Banana Gun’s Pro Platform Hits Ethereum as User Base Surpasses One Million

Why Africa’s Crypto Crackdown Was a Blessing in Disguise for Stablecoins and Digital Payments


