

Ethereum Price Prediction: $1,300 Low Before 400% Rally to $6,000
Ethereum Price Prediction: ETH at $1,568 With Bears Still in Charge
Ethereum (ETH) is changing hands around $1,568 at the time of writing, down significantly from its 2024 high near $4,800.
The latest Ethereum news shows bears have been in control since early 2025. Multiple break-of-structure (BOS) events on the daily chart confirm the downtrend is still intact.
One level is getting a lot of attention right now: $1,300.
Ethereum Price Forecast: What Are the Key Levels to Watch in June 2026?
The Ethereum price forecast for June 2026 is cautious. According to chart analysis from CryptoPatel on Binance, the altcoin broke below the $1,736 support level after failing to hold above $2,000.
Two major zones sit below the current price:
-
$1,300 is flagged as the "Best Accumulation Zone." This level has not been tested yet and is the biggest downside target traders are watching.
-
$1,595 is a short-term floor that it is hovering around right now.
The Fair Value Gap (FVG) between $1,840 and $1,980 failed to hold the price. That area has now become resistance. If the altcoin cannot recover above $1,840, the path toward $1,300 stays open.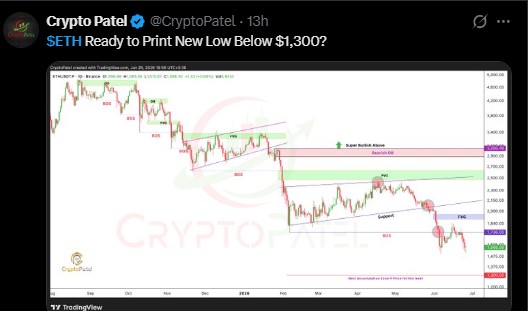
ETH Price Prediction for July 2026: Will Ethereum Find a Bottom?
The Ethereum price prediction for July 2026 depends heavily on whether it can stabilize in the $1,200 to $1,400 range.
Fibonacci extensions drawn from the swing high at $4,798 point to two critical support zones:
-
1.272 extension at $1,418
-
1.414 extension at $1,238
The second chart from Bybit projects a dip toward $1,231 followed by a bounce. If that plays out, the ETH price forecast targets $6,014 using the 385.76% Fibonacci extension, which represents a potential gain of roughly 400% from the lows.
The RSI on the daily chart is edging up from oversold territory. That alone does not confirm a reversal, but it does reduce the odds of a sharp vertical drop happening immediately.
Ethereum Price Prediction 2026: Three Scenarios Traders Are Watching
Here is how the full Ethereum price prediction 2026 picture looks across different scenarios:
Bearish case: If it continues lower toward $1,231 to $1,424. Macro pressure, weak on-chain activity, and continued selling by top traders drag the price into the accumulation zone. The $1,300 level holds as the bottom.
Base case: The altcoin finds support between $1,400 and $1,600, then slowly grinds sideways for several weeks through July 2026 before a trend shift develops.
Bullish case: The altcoin bottoms near $1,200 to $1,300, reclaims the $1,736 level, and eventually pushes toward $3,056 then $6,014. The full move could take until late 2026 or into 2027.
The descending channel visible on the Bybit daily chart still has room before hitting its lower boundary. That touch could be the setup many swing traders are waiting for.
ETH Price Forecast: Is the Bearish Order Block at $3,056 Blocking Recovery?
Yes, and it is one of the most important levels in the current eth price forecast.
The CryptoPatel chart marks a Bearish Order Block (OB) sitting between $2,900 and $3,100, with $3,056 being the key flip level. Until ETH closes above this zone on the daily chart with strong volume, the broader trend stays bearish.
The chart labels this level as "Super Bullish Above," meaning a confirmed break through $3,056 would signal a major structural change.
From $1,568, ETH needs to gain roughly 95% just to reach that level. That puts any full trend reversal in the medium to long-term category.
Ethereum ETH News: What Do Derivatives and Liquidations Say?
The latest ETH news from CoinGlass derivatives data shows the market is under strain.
Here is what the data shows right now:
-
Futures volume (24h): $34.33B, down 42.79%
-
Open Interest: $22.38B, up 0.99%
-
Overall Long/Short ratio (24h): 0.9968, almost perfectly split
-
Binance long/short (accounts): 2.09 (retail leans long)
-
Binance top trader long/short (positions): 1.43 (institutions more cautious)
-
Options volume: $670.46M, down 31.85%
Open interest rising while price falls is a red flag. It often signals new short positions being added or trapped longs getting squeezed lower.
In the last 24 hours, 67,487 traders were liquidated across all markets. Total liquidations hit $237.46 million. The single largest liquidation was a $3.66 million BTC-USD order on Hyperliquid.
Events like this can mark stress points in the market, though they are not a reliable buy or sell trigger on their own.
Ethereum Price Prediction June 2026: Why Is ETH Still Falling?
Several factors explain why the Ethereum price prediction for June 2026 leans bearish in the short term.
Macro risk-off conditions remain. When global markets are uncertain, money flows out of speculative assets like crypto first.
On-chain metrics show reduced demand. Gas fees on Ethereum are near multi-year lows, and DeFi activity has slowed. Less network usage means less organic demand for ETH as a utility token.
The chart structure tells the same story. The BOS labels across the CryptoPatel chart show at least five failed recovery attempts since late 2024. Every bounce has been sold.
Top traders on Binance hold a 1.43 long/short ratio in positions, compared to 2.09 for retail accounts. That gap matters. When professionals are more hedged than retail, it usually signals caution.
ETH Price Prediction: What Level Flips Ethereum Bullish Again?
Based on the chart structure, two events would change the ETH price prediction from bearish to bullish:
-
A clean bounce from the $1,200 to $1,300 range with a strong daily close and rising volume. This would confirm the accumulation zone is holding.
-
A breakout above the $1,736 level with follow-through. That would be the first major BOS to the upside in months.
Neither has happened yet. Until one of those two things occurs, the path of least resistance remains downward.
Disclaimer
This article is for informational purposes only and does not constitute financial advice, investment advice, or a recommendation to buy or sell any asset. Cryptocurrency markets are highly volatile and carry significant risk. Past performance is not indicative of future results. Always conduct your own research and consult with a licensed financial advisor before making any investment decisions.


You May Also Like

Seventh Straight Day of Outflows for Bitcoin and Ethereum ETFs

Jais raids Petaling Jaya premise over Shiite activities — 226 foreign nationals questioned

Cryptocurrency Market Shows Stability Amid Traditional Equity Volatility


