

Carvana Cut Net Debt to 1.1x EBITDA. Here’s Why the Balance Sheet Could Drive the Next Re-Rating
Key Stats for Carvana Stock
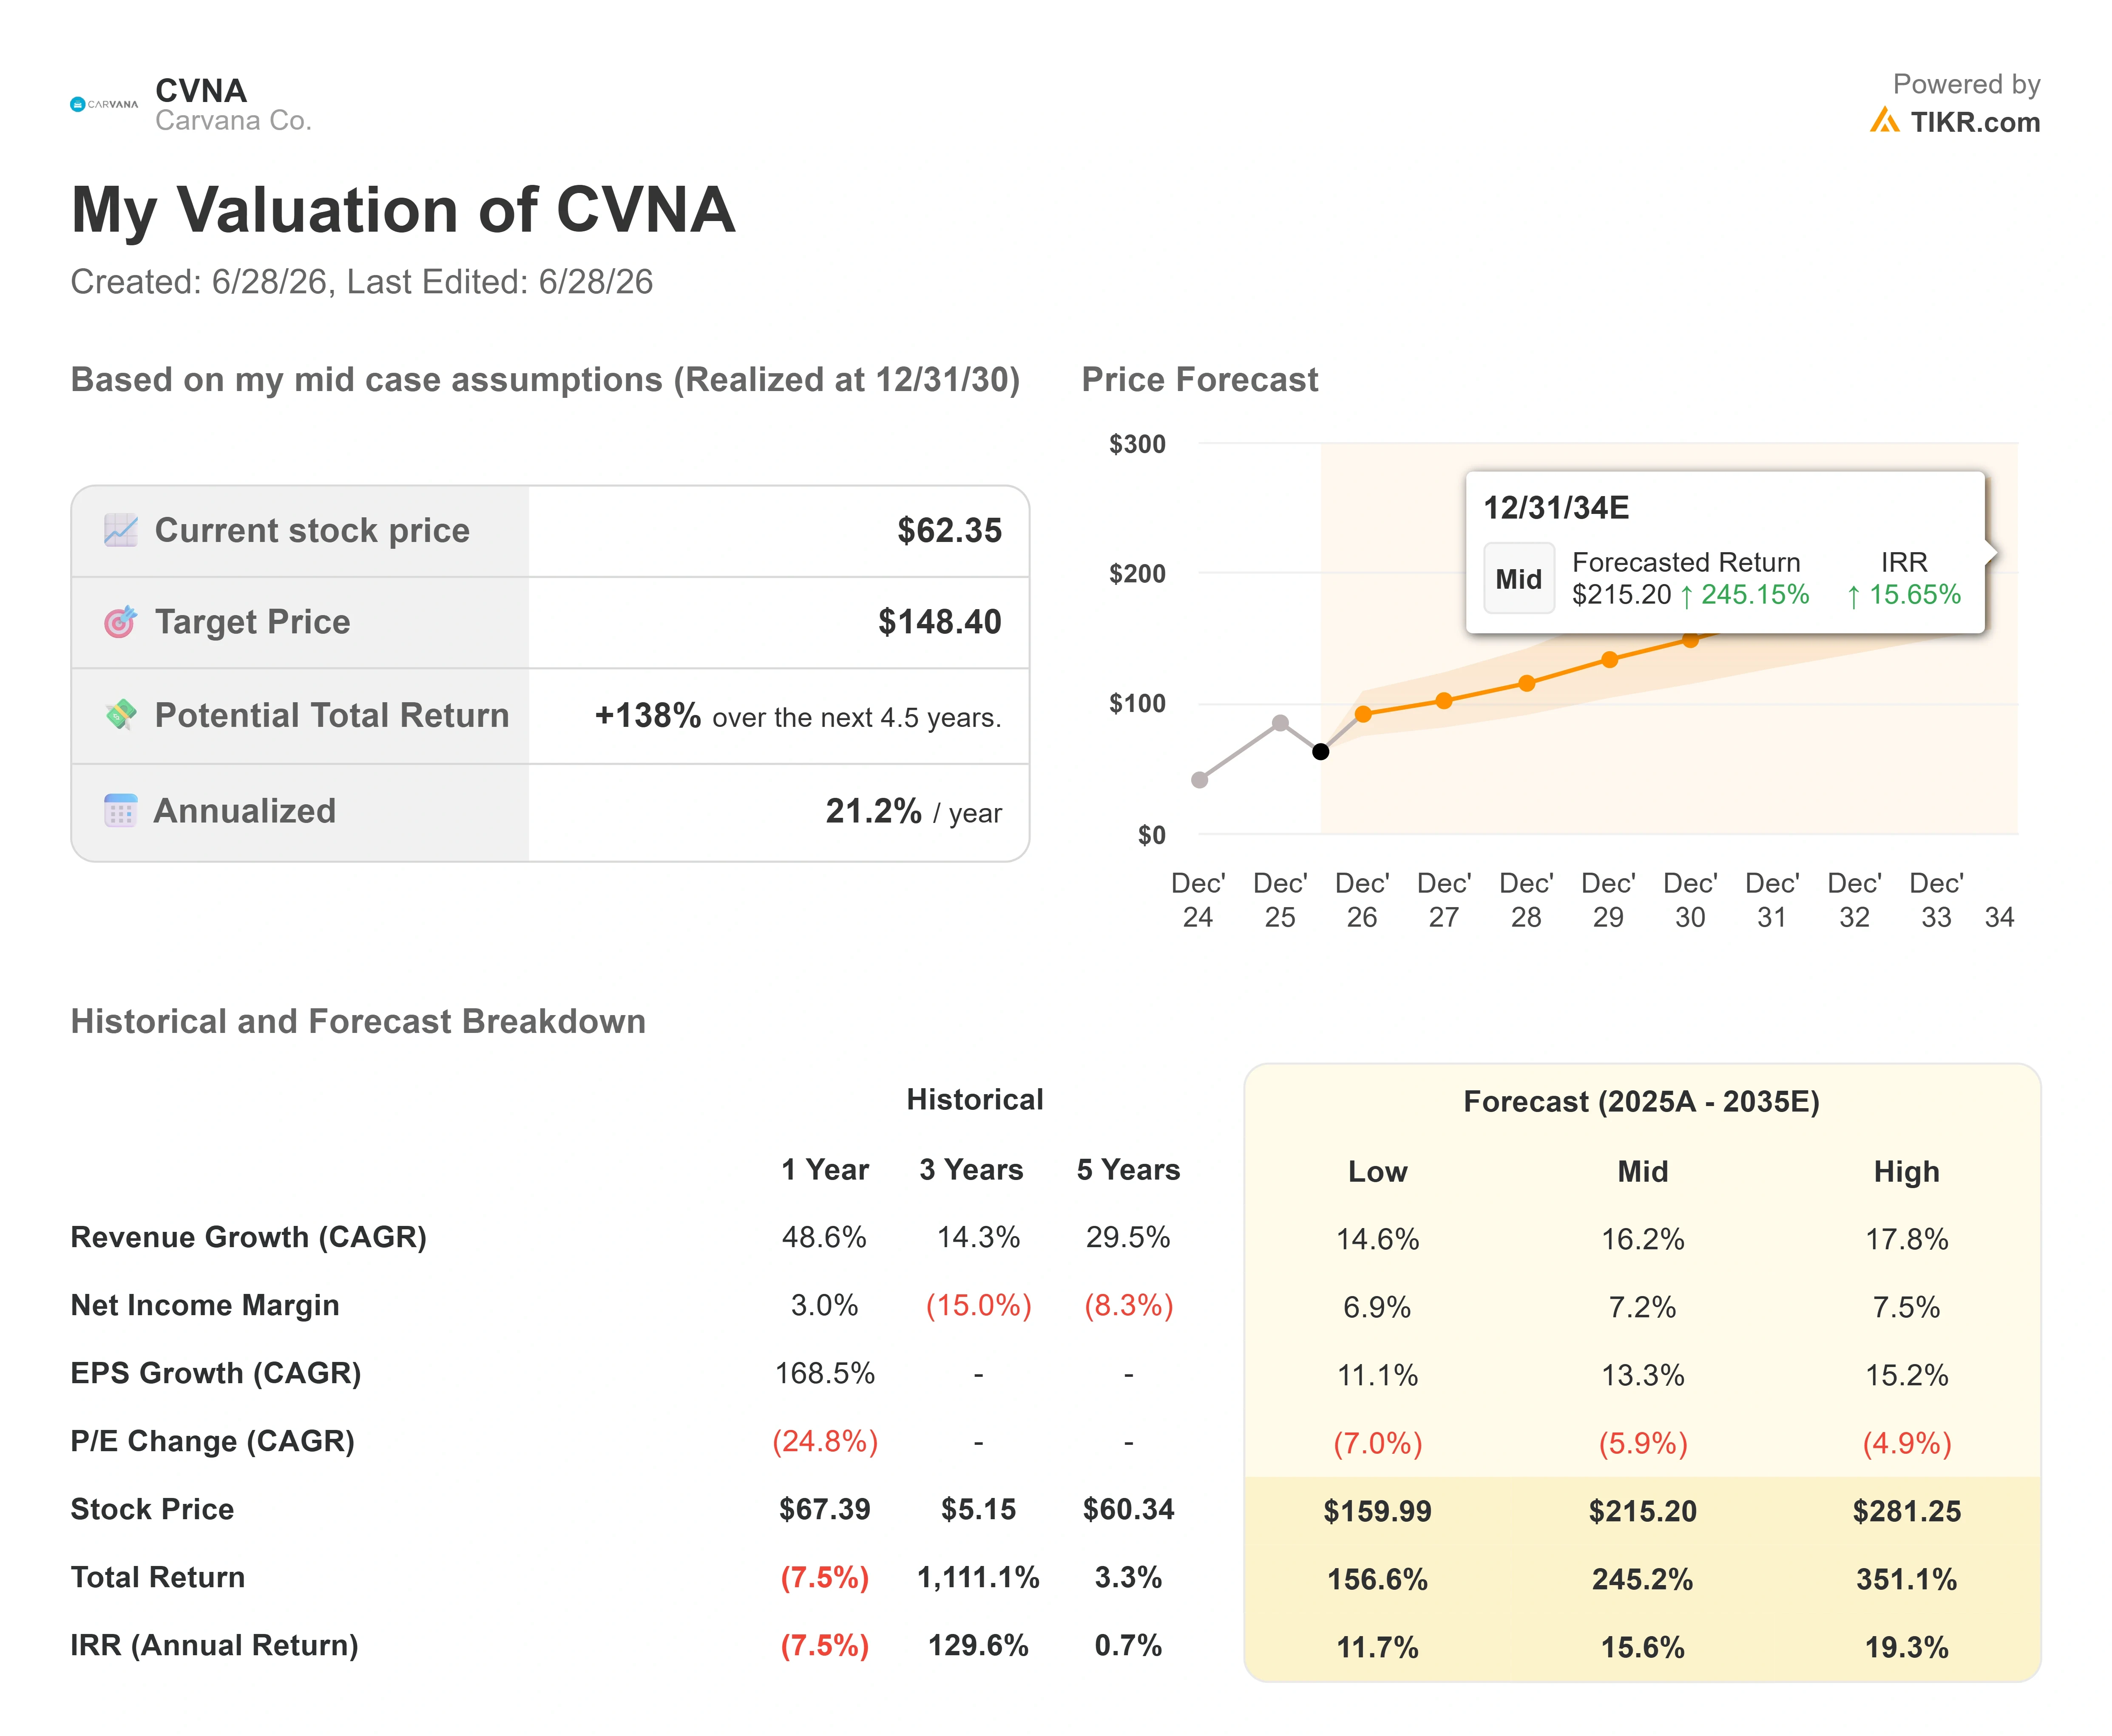
- Current Price: $62.35
- Target Price (Mid): ~$148
- Street Target: ~$92
- Potential Total Return: ~138%
- Annualized IRR: ~21% / year
- Earnings Reaction: -0.20% (April 29, 2026)
Now Live: Discover how much upside your favorite stocks could have using TIKR’s new Valuation Model (It’s free) >>>
What Happened?
Carvana Co. (CVNA) spent three years being valued for the thing that could kill it. The debt. In 2023, the online used-car retailer was negotiating with creditors and carrying net leverage that ran into the double digits. That fear never fully left the stock, even as the business healed. It is the reason CVNA trades at a steep premium to every traditional dealer, yet still sits closer to its 52-week low of $54.46 than its high of $97.38.
So here is the tension almost no one is pricing. The single number that defined the bear case is quietly disappearing. Bulls argue Carvana is a scaled, cash-generative compounder. Bears counter that the premium multiple cannot survive a capital-intensive expansion and a balance sheet still carrying $2.7 billion in net debt. The question neither camp has fully reckoned with: what happens to that debate when the debt is simply gone?
The Strongest Balance Sheet in Company History
On the first quarter 2026 earnings call, CFO Mark Jenkins put a hard number on the recovery. “In Q1, we again reduced our net debt to trailing 12-month adjusted EBITDA ratio to 1.1x, our strongest financial position ever,” he said. That matters because leverage was the entire reason the market once priced Carvana for failure. A company at 1.1x is no longer a credit story. It is an earnings story.
The improvement is not cosmetic. Carvana generated $405 million of net income in the first quarter, on revenue of $6.432 billion, up 52% year over year. Adjusted EBITDA hit a record $672 million at a 10.4% margin. The free cash flow that services and retires debt is now produced by operations, not raised from lenders. That is the structural shift the stock has not absorbed.
CEO Ernie Garcia framed the durability of the model on the same call, pointing to the company’s reconditioning recovery: “When we hit a bump, let’s react the way recon did. No one can stop us but us.” The line matters because the Q4 2025 reconditioning miss was the last operational scare attached to this stock, and Garcia confirmed the network was operating “just shy of our all-time best in labor efficiency throughout the network” by April.
 Carvana Net Debt & EBITDA (TIKR)
See historical and forward estimates for Carvana stock (It’s free!) >>>
Why the Premium Looks Different Through a Balance-Sheet Lens
Carvana’s valuation premium is real and worth confronting directly. On forward EV/EBITDA, which measures enterprise value against expected operating earnings, CVNA trades near 15.2x. The traditional dealers sit far lower: Penske (PAG) at 14.3x, Lithia (LAD) at 13.5x, and AutoNation (AN) at 10.4x, with the peer mean closer to 11.3x. On that single metric, Carvana looks expensive.
But enterprise value includes net debt, and that is exactly the figure about to shrink. As leverage falls, Carvana’s enterprise value converges down toward its market cap, which means the multiple bears point to is built partly on debt that is being retired. Strip the leverage risk out, and the premium the market is paying starts to look less like a leveraged bet and more like a price for growth that the dealers cannot match. The dealers grow units in the low single digits. Carvana grew retail units 40% in the first quarter, its sixth straight quarter at that pace. Investors are paying for the growth, and the balance sheet is removing the reason to discount it.
The deleveraging is not a hope. It is in the forward estimates. Consensus data on TIKR shows net debt falling from roughly $2.7 billion in 2025 to around $1.5 billion in 2026, then crossing into a net cash position in 2027 and building cash from there. That path is an analyst estimate, not company guidance, and it assumes capital spending stays contained even as management starts full build-outs of ADESA reconditioning facilities and absorbs the roughly $171 million spent acquiring Stellantis dealerships. A company that flips from net debt to net cash inside 18 months is not the same risk it was when the market last set this multiple. Morgan Stanley reached a similar conclusion in its June work, projecting strong cash conversion as the business scales, though RBC trimmed its target to $85 in June on more conservative market-share assumptions. The disagreement is real, but it is a disagreement about the pace of cash generation, not whether it is coming.
 Carvana Free Cash Flow (TIKR)
See how Visa Inc. performs against its peers in TIKR (It’s free!) >>>
TIKR Advanced Model Analysis
- Current Price: $62.35
- Target Price (Mid): ~$148
- Potential Total Return: ~138%
- Annualized IRR: ~21% / year
 Carvana Advanced Valuation Model (TIKR)
See analysts’ growth forecasts and price targets for Carvana stock (It’s free!) >>>
Using the mid-case scenario realized at 12/31/30, the TIKR Valuation Model targets around $148 per share, a potential total return of about 138%, and an annualized return near 21% per year. The two revenue drivers are continued unit growth toward the long-term goal of 3 million cars per year, and rising revenue per unit as new reconditioning capacity comes online, with mid-case revenue growth in the mid-teens. The margin driver is fixed-cost leverage: overhead grows more slowly than units, lifting net margin toward roughly 7% on the path to management’s stated 13.5% adjusted EBITDA margin target. The primary risk is the used-car cycle, where a weaker job market or tighter auto credit would slow units and compress per-unit economics.
The upside case is straightforward: a net-cash balance sheet plus continued share gains justify the premium and the model’s mid-teens annual return, even with revenue growth stepping down from today’s pace toward the mid-teens.
The downside case is equally clear: if the used-car cycle turns, unit growth slows, and a premium multiple on cyclical earnings compresses fast.
Conclusion
Watch net debt when Carvana reports second-quarter 2026 results on July 29. The figure to track is the net debt to trailing EBITDA ratio. Good looks like another sequential step down from 1.1x, confirming the company is on track to reach net cash in 2027 and removing the last pillar of the bear case. Bad looks like leverage ticking up as capital spending on reconditioning build-outs and the new-vehicle push outrun cash generation, which would hand bears a reason to keep discounting the multiple. The new-car expansion will not move the financials in a single quarter, so the balance sheet is the cleaner signal. If the deleveraging holds, the distance between $62 and the model’s $148 stops being about whether Carvana can survive, and starts being about how much the market underpriced a compounder it still treats like a turnaround.
See what stocks billionaire investors are buying so you can follow the smart money with TIKR.
Should You Invest in Carvana?
The only way to really know is to look at the numbers yourself. TIKR gives you free access to the same institutional-quality financial data that professional analysts use to answer exactly that question.
Pull up Carvana, and you’ll see years of historical financials, what Wall Street analysts expect for revenue and earnings in the quarters ahead, how valuation multiples have moved over time, and whether price targets are trending up or down.
You can build a free watchlist to track Carvana alongside every other stock on your radar. No credit card required. Just the data you need to decide for yourself.
Analyze Carvana on TIKR Free →
Looking for New Opportunities?
- See what stocks billionaire investors are buying so you can follow the smart money.
- Analyze stocks in as little as 5 minutes with TIKR’s all-in-one, easy-to-use platform.
- The more rocks you overturn… the more opportunities you’ll uncover. Search 100K+ global stocks, global top investor holdings, and more with TIKR.
Disclaimer:
Please note that the articles on TIKR are not intended to serve as investment or financial advice from TIKR or our content team, nor are they recommendations to buy or sell any stocks. We create our content based on TIKR Terminal’s investment data and analysts’ estimates. Our analysis might not include recent company news or important updates. TIKR has no position in any stocks mentioned. Thank you for reading, and happy investing!
You May Also Like

The Trade Desk Is Down 51% in 2026. Is the Multiple Finally Cheap Enough?

How Binance Turned CZ Into a Billionaire Richer Than Bill Gates

Michael Saylor teases more bitcoin buying even as Strategy stock continues to fall

