Here’s Why Gold Price Is Crashing Right Now
Gold price crashed below $4,000 per ounce again today. The metal is down -2% in the last 2 hours, falling below $3,950 and hitting a 34‑week low.
Gold is now down -30% from its peak, wiping out over $12 trillion in market value. The decline has been relentless. From the January record high near $5,595, gold has now given back all its gains and more.
The Japanese Yen Collapse
The Japanese yen just collapsed to its weakest level against the U.S. dollar since 1986. This is a major macro event that is putting additional pressure on gold.
Peter Schiff weighed in on the move: “Gold is back below $4K again. The Japanese yen is also hitting a new 40-year low against the dollar this evening, which is likely weighing on gold. But yen sellers are jumping from the frying pan into the fire by buying dollars. A much better move would be buying gold instead.”
The BOJ actually raised rates to 1.0% on June 16 – the highest level in 31 years. But the yen still collapsed because the Fed’s hawkish outlook kept the dollar strong, and the BOJ signaled it would slow its bond‑buying reduction, weakening the impact of the hike. Schiff’s point stands: selling yen for dollars is chasing a strong dollar trend that may not last, making gold a better long‑term hedge.
Does a Weak Yen Affect Gold?
Yes, a weak yen can affect gold, but the relationship is more complex than it appears.
The direct effect: When the yen weakens against the dollar, it makes dollar‑denominated assets like gold more expensive for Japanese investors. This can reduce demand from one of the world’s largest gold‑buying nations.
The indirect effect: A weak yen is often a sign of a strong dollar. The dollar index rises when the yen falls. Since gold is priced in dollars, a stronger dollar typically weighs on gold prices.
The carry trade dynamic: The yen’s weakness is partly driven by the carry trade – investors borrow cheap yen to buy higher‑yielding assets. When the yen weakens further, these trades become more profitable, pulling capital away from safe‑haven assets like gold.
The counterintuitive view: Schiff argues that buying dollars is a mistake. He believes gold is the better safe haven. But in the short term, the dollar strength is overwhelming gold.
Gold Chart Analysis: Bearish Trio – RSI, MACD, and Moving Averages
The technical picture for gold is decisively bearish on the 1‑hour timeframe.
| Indicator | Value | Signal |
|---|---|---|
| RSI (14) | 38.9 | Sell – Below neutral 50, weak momentum, more sellers than buyers |
| MACD | -18.88 | Sell – Negative and below signal line, bearish momentum accelerating |
| SMA50 | 4,054.10 | Sell – Short‑term average above price |
| SMA200 | 4,121.37 | Sell – Long‑term average above price, confirming downtrend |
What this means:
- Momentum loss: RSI below 40 means buyers are stepping aside.
- MACD confirms: A negative MACD with a “Sell” action means the trend is gathering downside speed.
- Trend structure: Price is below both the 50‑ and 200‑period moving averages – a classic sign of a market under pressure.
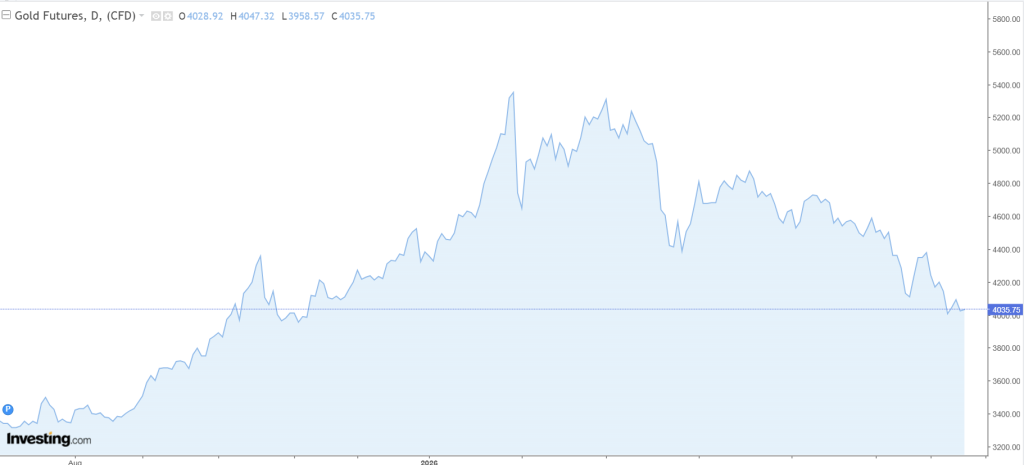 Source: investinig.com
Longer‑term context: Daily and weekly charts remain bearish, though monthly signals hint at possible relief rallies ahead. The risk is that if price breaks below recent support, sellers could accelerate the move lower.
What’s Driving the Bearish Setup
1. Hawkish Fed expectations: Markets are pricing in further rate hikes. Higher yields and a stronger dollar make non‑yielding gold less attractive.
2. Strong dollar: The dollar index is at multi‑month highs. Gold and the dollar have a strong inverse correlation.
3. Yen collapse: The yen’s weakness is reinforcing dollar strength, adding pressure on gold.
4. Technical breakdown: Gold has broken below the $4,000 psychological support. That has triggered more selling from stop‑loss orders.
5. No safe‑haven bid: The U.S.-Iran tensions have eased. Geopolitical risk premiums are fading.
Read also: Gold and Silver Prices Crash May Be Over; Robert Kiyosaki Says a Long Rally Could Be Next
Gold Price Predictions
Short‑term (next few days): Gold price is testing the $3,950 level. If that breaks, the next support is $3,900. RSI at 38.9 suggests more downside before oversold conditions are reached. The MACD is accelerating lower. Expect continued pressure.
Medium‑term (next 2‑4 weeks): If the dollar continues to strengthen and the Fed remains hawkish, gold could test $3,800. The 30% correction target near $3,915 is now in play. A break below $3,800 would open the door to $3,600.
Long‑term (rest of 2026): If the Fed signals a pause or rate cuts, gold could rally toward $4,300‑$4,500. Central bank buying should provide a floor. China added to its reserves in May for the 19th consecutive month. That structural demand is still there.
FAQs

A combination of a strong dollar, hawkish Fed expectations, the Japanese yen collapse, and a technical breakdown below $4,000. The safe‑haven bid has faded as geopolitical tensions ease.
For long‑term investors, the $3,900‑$3,950 zone offers a reasonable entry. But the short‑term trend is bearish, and a break below $3,800 could trigger more selling.
Subscribe to our YouTube channel for daily crypto updates, market insights, and expert analysis.
The post Here’s Why Gold Price Is Crashing Right Now appeared first on CaptainAltcoin.


You May Also Like

SkyEcosystem Shares Insight on Stablecoin FX Layer — How It Affects Market Dynamics

Cryptocurrency Companies Fleeing Europe! High Interest in This Country Due to MICA Regulation! Here Are the Details