

CoreWeave Stock Drops 24% Despite $99.4B AI Backlog—Buy or Trap?

CoreWeave Stock has shed roughly 24% over the past month, trading near $81.74. A massive $99.4 billion AI backlog and 112% revenue growth clash with a broken technical structure. The question: is this a structural breakdown or a panic-driven dip?
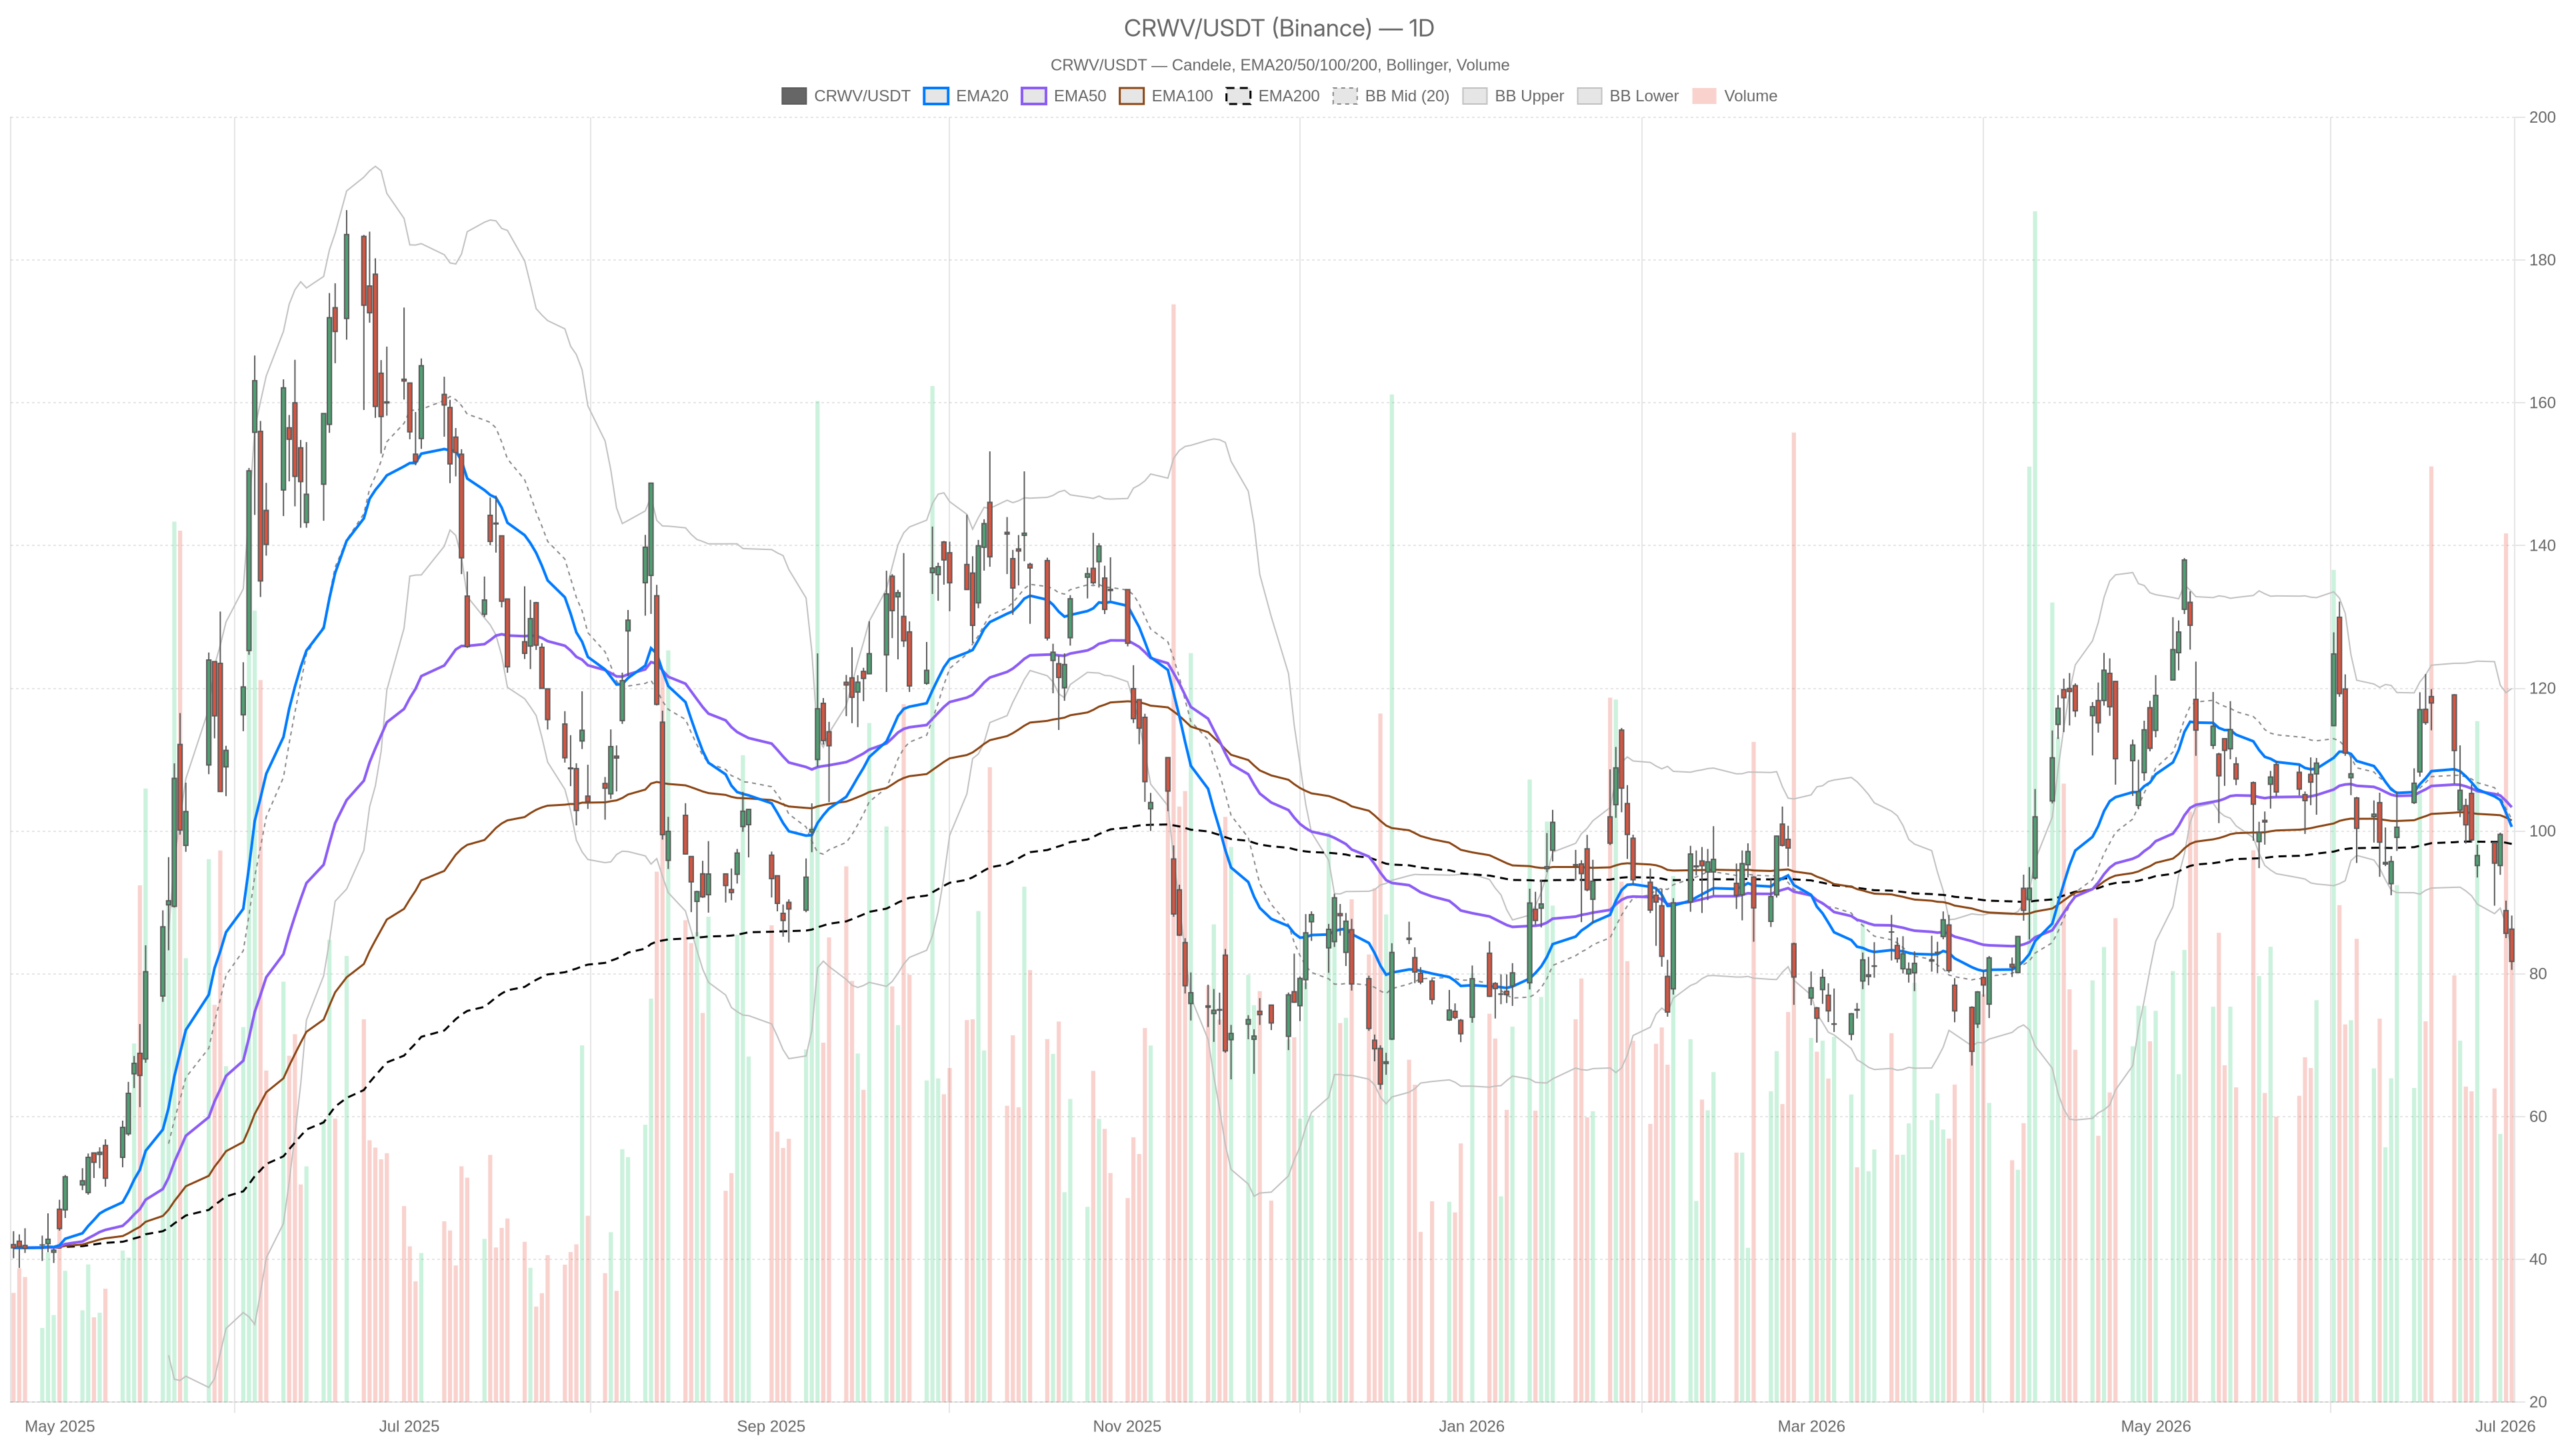 CRWV — daily chart with candlesticks, EMA20/EMA50 and volume.
Key takeaways
- CoreWeave Stock (CRWV) is down ~24% in the past month, closing at $81.75 on July 2
- A $99.4 billion AI services backlog and 112% YoY revenue growth contrast sharply with bearish technicals
- Daily RSI at 33.69 nears oversold; price has broken below the lower daily Bollinger Band
- All major EMAs sit above price, acting as overhead resistance with no dynamic support in sight
- The bearish bias dominates; reclaiming the $83.49 daily pivot is the minimum requirement for any trend shift
Daily Timeframe: CoreWeave Stock’s Bearish Structure
CoreWeave Stock’s daily chart is firmly bearish. Price sits below all major moving averages with no dynamic support in sight. Every average now acts as overhead resistance rather than a floor.
EMA Configuration Confirms the Downtrend
On the daily chart, CoreWeave closed at $81.75. The stock sits below the EMA20 at $100.60, the EMA50 at $103.35, and the EMA200 at $98.21. All three averages are stacked above current price in a clear bearish configuration.
Momentum Nears Oversold Without Capitulation
The daily RSI at 33.69 is approaching oversold territory but has not crossed below 30. This is a meaningful reading. The stock is technically oversold on momentum. However, it has not yet reached the kind of extreme exhaustion that precedes sharp reversals.
Meanwhile, the MACD on the daily chart is deeply negative. The MACD line sits at -4.74, well below the signal line at -2.31. The histogram of -2.42 confirms downward momentum remains dominant. There is no sign of crossover or compression hinting at a near-term trend shift.
Meanwhile, Bollinger Bands on the daily frame show the midpoint at $101.69. The lower band stands at $83.39. Price at $81.75 has effectively broken below the lower band. That kind of extension is rare. It often signals either capitulation or the start of a sustained downtrend. The daily ATR of $8.87 underlines the high volatility regime.
The daily pivot analysis places the pivot point at $83.49. S1 sits at $78.81 and R1 at $86.42. Price remains below the daily pivot, confirming short-term bearish bias. A failure to reclaim $83.49 keeps sellers in control. S1 at $78.81 is the next meaningful downside reference.
Hourly Timeframe: Confirming the Bearish Lean
The hourly chart reinforces CoreWeave Stock’s bearish bias with even deeper oversold readings. The intraday selloff appears particularly sharp. It may be due for at least a technical pause.
Hourly RSI has dropped to 27.70 — firmly oversold. This is more extreme than the daily reading. It signals that the intraday selling has accelerated sharply. A technical pause or dead-cat bounce may be near. However, oversold alone does not confirm a reversal.
On the hourly chart, EMAs tell the same story as the daily. Price at $81.74 is far below the EMA20 ($87.08), EMA50 ($93.51), and EMA200 ($103.35). The substantial gap reflects the velocity of the decline rather than a gradual trend change. The hourly regime is explicitly bearish.
In contrast to the daily MACD’s deep divergence, the hourly MACD histogram at -0.42 is notably narrowing. The line at -4.19 versus a signal of -3.77 shows slight compression. This does not confirm a reversal. Still, it suggests the rate of bearish acceleration may be slowing. It is a nuance worth watching.
The hourly Bollinger Bands place the lower boundary at $75.51. This gives theoretical room for further downside before another extreme extension. The hourly ATR at $2.78 confirms continued elevated intraday volatility.
15-Minute Timeframe: A Flicker of Stabilization
The 15-minute chart offers the only hint of stabilization for CoreWeave Stock across all timeframes. It is a modest signal that does not override the bearish higher-timeframe view.
Specifically, the MACD histogram on this timeframe is slightly positive at +0.32. The MACD line at -1.02 has crossed above the signal at -1.33. This is a micro-timeframe development. It suggests short-term selling pressure may be temporarily exhausting near current levels.
Meanwhile, the 15-minute RSI at 36.59 is recovering from lower levels, consistent with a brief stabilization. Price trades near the 15m Bollinger midband at $81.73, closely aligned with the current quote. The 15m ATR of $0.65 defines the immediate execution range. For intraday traders, this signals a narrow consolidation zone between $81.42 (S1) and $82.02 (R1).
Overall, the 15-minute data provides context for short-term timing rather than directional conviction. It does not contradict the bearish higher-timeframe view.
CoreWeave Stock Fundamental Backdrop: Meta Shock vs. Structural Demand
The Meta competitive shock is driving CoreWeave Stock’s selloff. However, the fundamental picture remains deeply mixed, with both real threats and compelling strengths.
Reports of Meta Platforms building its own commercial cloud infrastructure business directly rattled CRWV investors. The concern is logical. Meta as a competitor in AI compute clouds could erode CoreWeave’s addressable market and pricing power. The market sold first and asked questions later.
However, the counter-narrative is equally compelling. CoreWeave carries a $99.4 billion AI services backlog. Revenue grew 112% in Q1. The company holds NVIDIA backing and operates at strong margins. BNP Paribas recently highlighted CRWV as a potential catch-up trade relative to peers. The new BattleBots Pro League partnership signals the company’s push into brand visibility and enterprise AI credibility.
At the same time, the Meta threat is real in the long term. If large hyperscalers vertically integrate their AI compute capacity, the entire third-party cloud GPU model faces structural pressure. That risk justifies a valuation reset. Still, a 24% monthly decline may be pricing in more fear than near-term fundamentals warrant.
CoreWeave Stock Bullish Scenario: Exhaustion, Reclaim, Rebound
CoreWeave Stock could stage a rebound if oversold exhaustion meets fundamental resilience. The technical setup is stretched to levels where asymmetric recoveries have historically emerged.
The bullish case rests on technical exhaustion. Daily RSI approaching 30 signals a deeply oversold market. Price below the lower Bollinger Band reinforces the extreme. Hourly RSI already in oversold territory further confirms that selling has been aggressive. If CRWV stabilizes above $78.81 and reclaims the $83.49 pivot, dip buyers would be absorbing supply.
A meaningful recovery would require the stock to push back through $86.42 (daily R1). From there, it would need to close the gap toward the EMA20 near $100. That is a long road. However, the destination is not unreasonable. The stock carries 112% revenue growth and a nearly $100 billion backlog. Flattening in the hourly MACD histogram would offer meaningful early confirmation.
Notably, a catalyst could emerge. If Meta clarifies its cloud ambitions do not directly compete with CoreWeave’s GPU leasing model, the result could be sharp short-covering. An oversold tape would amplify the move.
Bearish Scenario: Structure Stays Broken, Support Fails
The bearish case for CoreWeave Stock is technically straightforward. Broken structure offers no near-term support. Any rally attempt risks being sold quickly.
If price fails to hold above $78.81, the next downside area becomes wide open. The lower Bollinger Band offers no meaningful structural support given how extended price already is. With all EMAs acting as resistance well above current levels, any bounce faces immediate overhead pressure.
On the fundamental side, the bearish case strengthens if further evidence of hyperscaler insourcing emerges. Rising competition from established players and newer entrants like Nebius could compress CoreWeave’s margins and pricing power. Heavy capital expenditure requirements mean that any revenue growth deceleration would hit earnings disproportionately hard.
In contrast to the hopeful backlog narrative, some contracts may carry execution risk. Customer concentration or contract flexibility could be higher than disclosed. That uncertainty alone keeps risk-off sellers active on any bounce.
Positioning and Volatility Outlook
CoreWeave Stock is among the higher-volatility names in AI infrastructure. A daily ATR of nearly $9 means routine swings of that magnitude are entirely normal. Position sizing must reflect this reality.
The dominant bias remains bearish across all meaningful timeframes. The daily and hourly charts are aligned in that direction. Only the 15-minute chart shows the faintest hint of stabilization. That is not a basis for directional conviction. Therefore, the near-term path of least resistance is still lower. Price must decisively reclaim the $83.49 pivot zone to shift the outlook.
Still, the conflict between deeply oversold technicals and a still-intact bearish trend defines CRWV right now. That environment — oversold but not yet reversing — is precisely where premature bottom-picking gets punished. Patience, clear levels, and respect for the volatility regime are the correct framework.
This is a high-conviction story in both directions. The market has not yet decided which one wins.
FAQ
Why is CoreWeave Stock falling?
CoreWeave Stock has declined sharply following reports of Meta Platforms building its own cloud infrastructure business. This raised competitive concerns for CoreWeave’s AI cloud compute model. Broader AI sector sentiment and a technically broken daily chart have added to the selling pressure.
Is CoreWeave Stock oversold?
Yes, CoreWeave Stock shows oversold readings on both the daily RSI at 33.69 and hourly RSI at 27.70. Price has also broken below the lower daily Bollinger Band. However, oversold conditions alone do not confirm a reversal. They signal that selling has been aggressive but may not yet be exhausted.
What are the key levels to watch for CoreWeave Stock?
The daily pivot at $83.49 is the immediate level CoreWeave Stock must reclaim for any bullish shift. Support sits at $78.81 (S1). Resistance stands at $86.42 (R1). The EMA20 near $100 represents a medium-term recovery target that would require sustained buying momentum.
Does the $99.4 billion backlog make CoreWeave Stock a buy?
The backlog and 112% revenue growth suggest strong fundamental demand for CoreWeave Stock. However, the technical structure remains broken. The Meta competitive threat and potential execution risk on backlog contracts justify caution. This is a high-upside, high-risk setup rather than a clear buy signal.
Disclaimer: This article is for informational purposes only and does not constitute financial advice, an investment recommendation, or a solicitation to buy or sell any financial instrument or cryptocurrency. The analysis provided is not indicative of future results. Investing in crypto assets and financial markets carries a high risk of capital loss. Always do your own research (DYOR) and consult a qualified financial advisor before making any decision.
Article produced with the assistance of artificial intelligence and reviewed by the editorial team.


You May Also Like

South Korea Plans New Law to Seize Crypto Assets in Civil Cases

Sri Lanka’s worst prison riot in five years kills 23 guards and inmates, wound more than 100

Beyond Starlink: Amazon Leo, Spacesail, Space24 seek entry into South Africa



