

Polkadot Price Crash Alert: : Will $1.20 Support Collapse Next?

The post Polkadot Price Crash Alert: : Will $1.20 Support Collapse Next? appeared first on Coinpedia Fintech News
Polkadot is flashing warning signs as bearish pressure intensifies, with price slipping sharply after a clean rejection at a key resistance zone. The latest structure suggests this isn’t just a pullback, it could be the start of a deeper downside move toward critical liquidity levels.
With sellers firmly in control and market positioning turning negative, the big question now is clear: Is the Polkadot price heading toward a breakdown below $1.20?
Shorts Dominate as Sentiment Turns Bearish
Market data is increasingly aligning with the downside narrative. Latest derivatives data shows a clear imbalance, with 32.82 million short positions versus 17.80 million longs, highlighting strong bearish conviction. At the same time, net delta remains negative, confirming that sell-side pressure continues to dominate order flow.
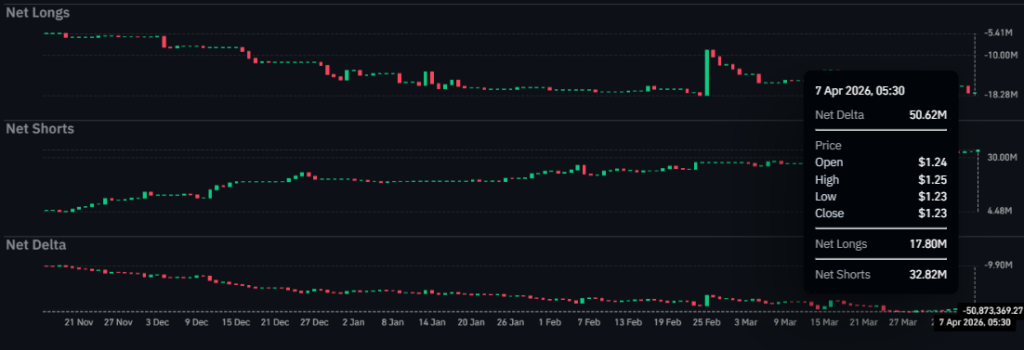
This imbalance suggests that traders are actively positioning for a continuation lower, rather than preparing for a reversal. The absence of aggressive long buildup further reduces the likelihood of a short squeeze in the near term.
DOT Price Confirms Breakdown Setup At Resistance
Polkadot remains firmly within a bearish continuation framework. DOT price recently tapped into a higher timeframe premium zone near $1.30–$1.32, aligning with a weekly breaker level, before sharply rejecting. This move swept buy-side liquidity above the previous weekly high, a classic signal of distribution before downside expansion.
With the higher timeframe continuing to print lower highs, the broader structure remains bearish. Current price action suggests that DOT is now rotating toward sell-side liquidity below recent lows, reinforcing the continuation thesis.
Key Levels To Watch
Polkadot is approaching a critical range where the next move could accelerate quickly. Immediate support is located at $1.20, followed by $1.17, both acting as short-term liquidity zones. A decisive breakdown below these levels would likely open the door toward $1.10, which stands as the next major downside target.
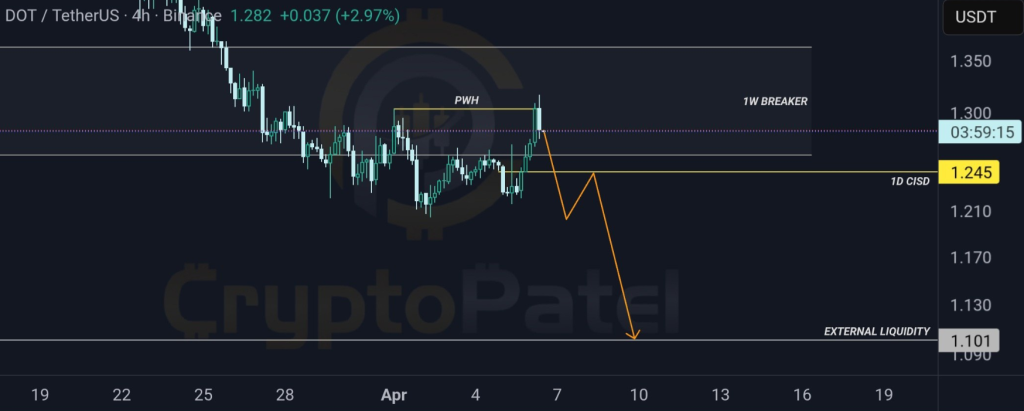
On the upside, $1.32 remains the invalidation level. A sustained move above this zone would disrupt the bearish structure and signal a potential shift in momentum. Until then, DOT price action continues to favor downside expansion over recovery.
Outlook: Breakdown risk rising fast
Polkadot is entering a phase where structure and positioning are fully aligned to the downside. As long as the price remains capped below $1.30–$1.32, the probability of a breakdown toward $1.20 and potentially $1.10 continues to increase.
Any short-term bounce is likely to be corrective, unless bulls reclaim resistance with strong conviction. For now, DOT remains in a high-risk zone, where a confirmed break below support could trigger accelerated downside continuation.


Ayrıca Şunları da Beğenebilirsiniz

Top Crypto to Watch Right Now? Experts Highlight This Altcoin Under $1

ETH Enters High-Stakes Decision Zone

Emergency room doctor names worrying Trump behavior: 'Something just seems not right'


Popüler Haberler
Daha fazla
