

SoftBank Group Stock Holds Uptrend as Price Presses 20.80 Resistance

SoftBank Group Stock (SFTBY) remains in a daily uptrend while leaning into low‑20s resistance. However, daily momentum has cooled, arguing for a more tactical stance as price probes overhead supply.
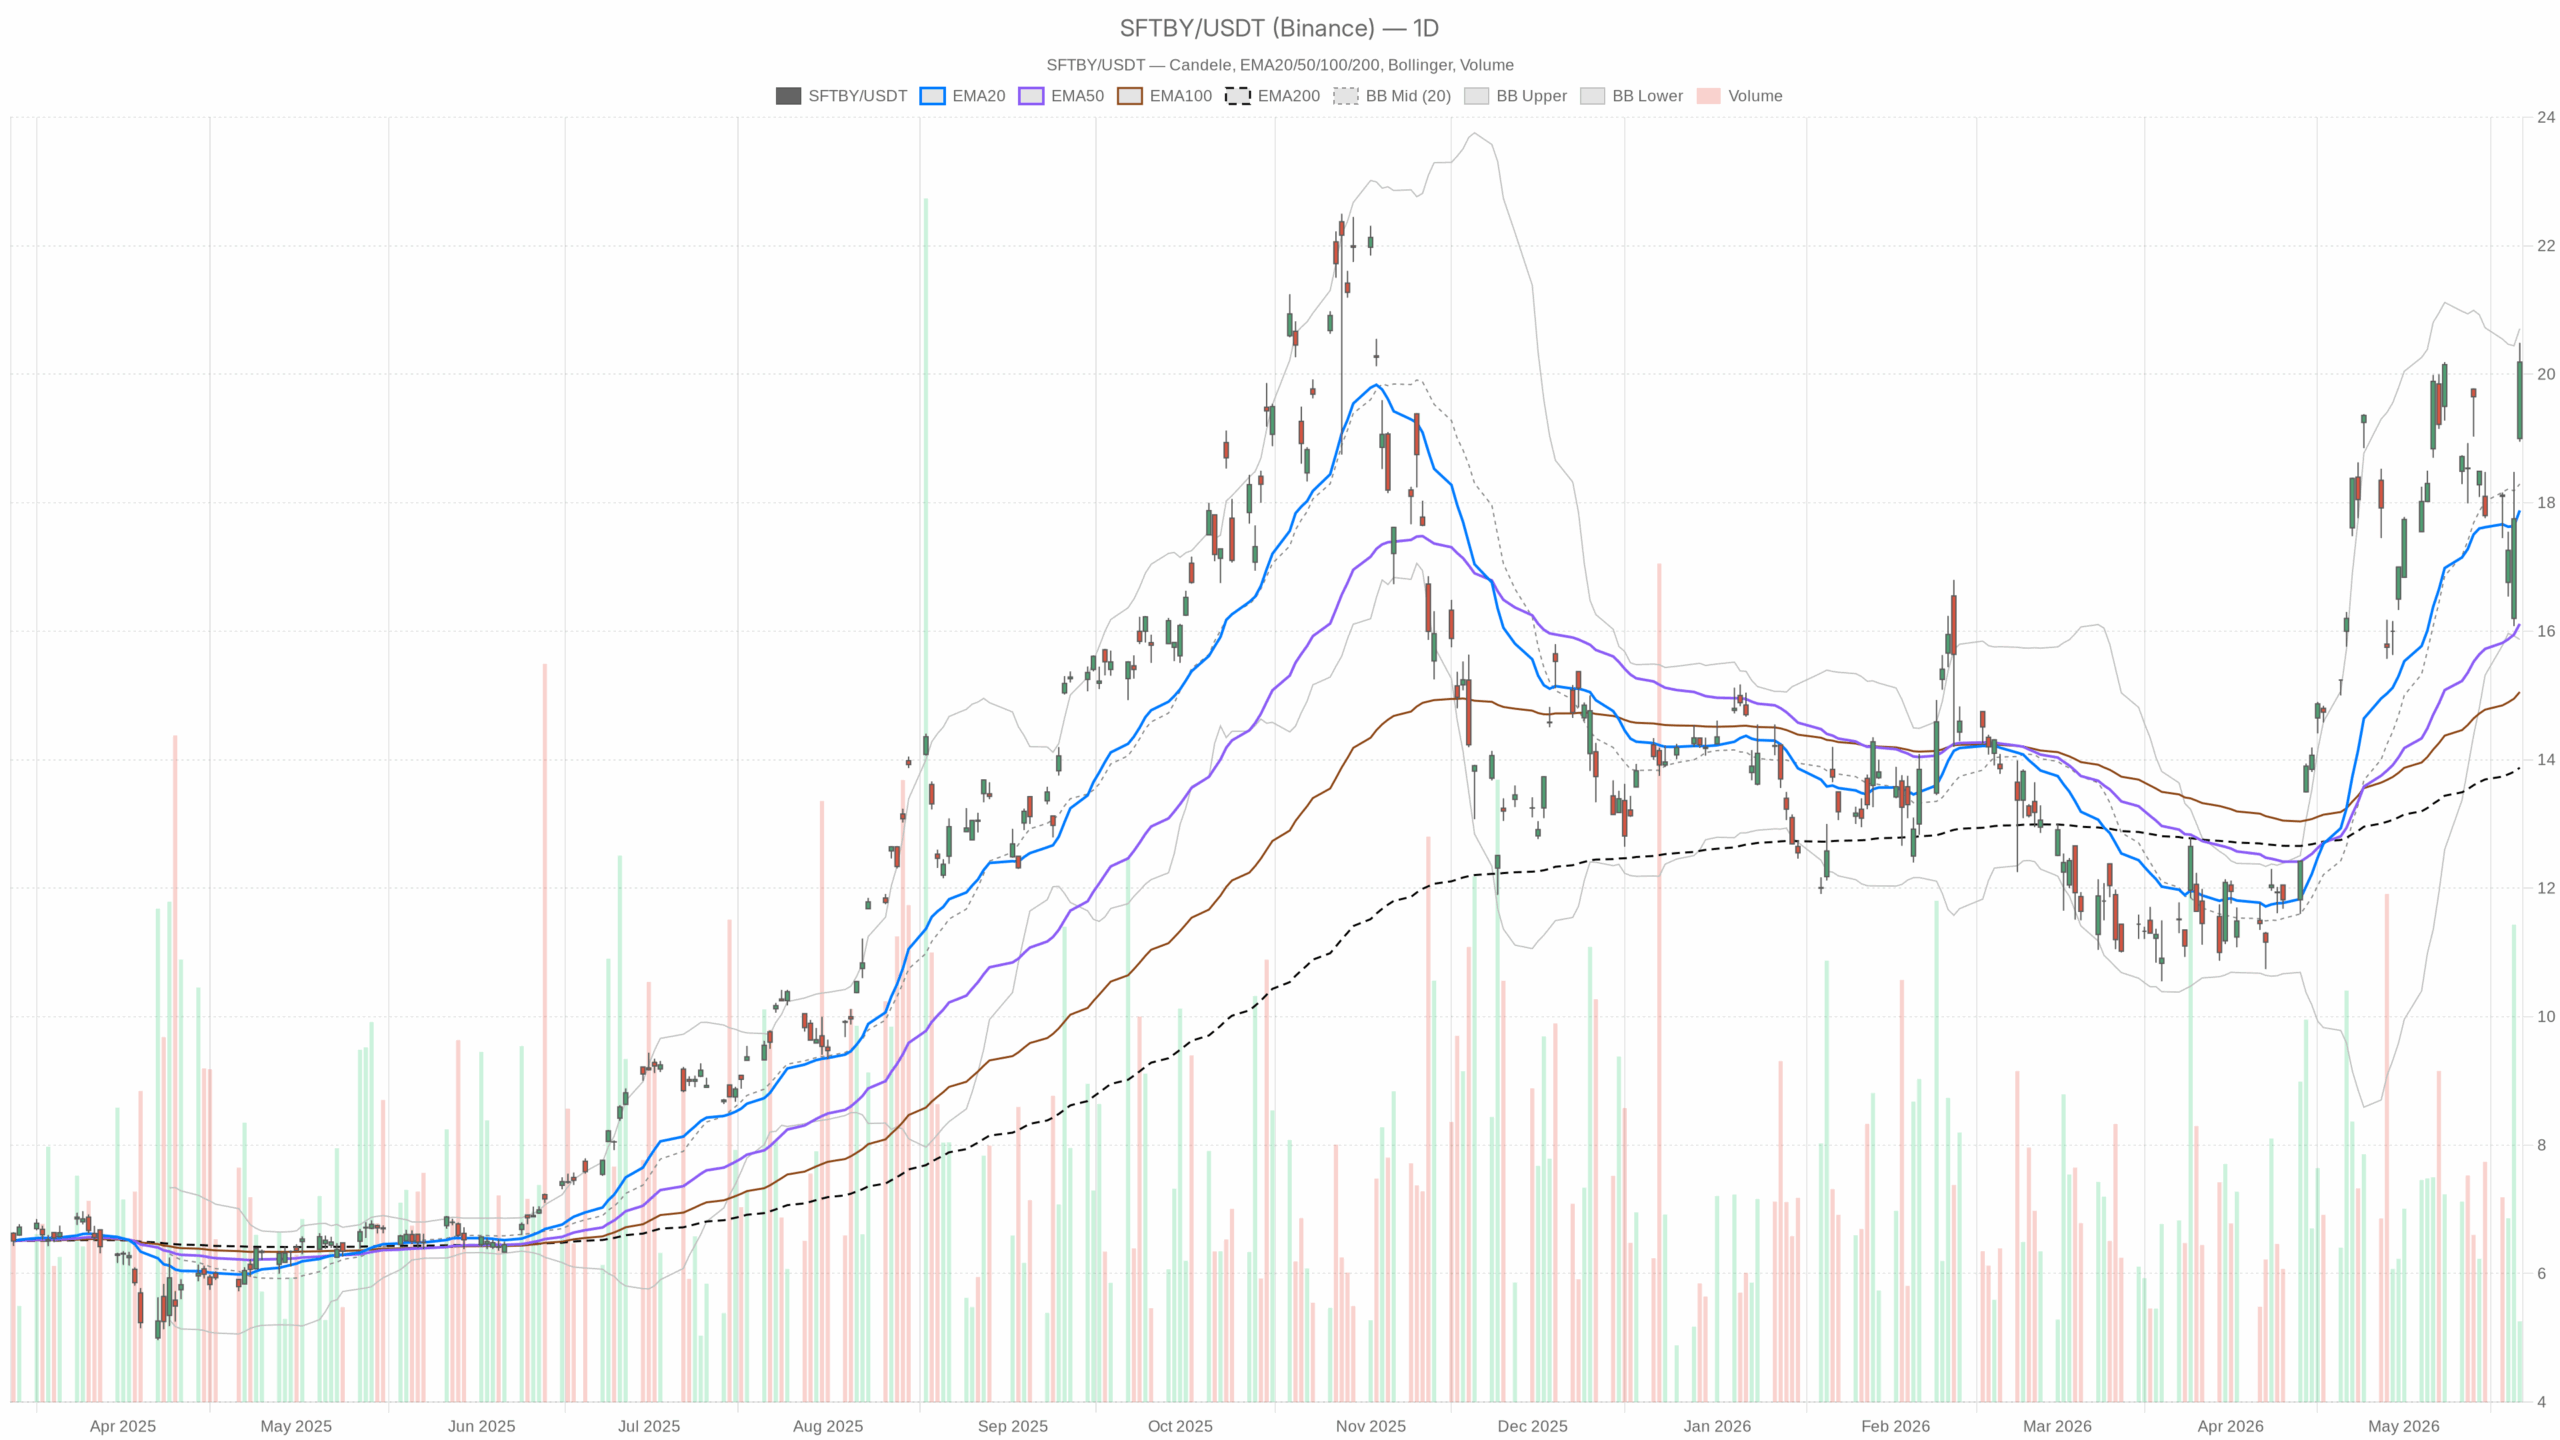 SFTBY — daily chart with candlesticks, EMA20/EMA50 and volume.
SoftBank Group Stock: Daily uptrend and resistance near 20
On the daily timeframe, SFTBY closed at 20.19 after trading between 18.95 and 20.49. Price finished above the daily pivot at 19.88 and below R1 20.80. That is constructive positioning with resistance close by.
EMA20/50/200 print 17.88/16.11/13.88, a bullish stack with healthy separation that confirms trend strength. RSI14 sits at 62.25, signaling firm upside without a classic overbought read. MACD shows line 0.97 versus signal 1.16; the histogram at -0.19 indicates easing, not reversing, momentum.
Bollinger Bands place the mid at 18.29, upper at 20.71, and lower at 15.87. The close near the upper band underscores strength and leaves room to probe 20.71. Meanwhile, ATR14 at 1.32 flags elevated daily volatility. Therefore, 20.80 remains the next hurdle, with 19.26 the first downside guardrail.
Hourly chart: buyers retain control with nearby caps
The 1H chart corroborates the bullish daily bias. The latest hourly close sits at 20.19, above the hourly pivot at 20.09 and beneath R1 20.29. Buyers hold the initiative but face immediate resistance.
Hourly EMA20/50/200 at 18.85/18.46/17.12 are rising and positively aligned, favoring pullback buying on dips. RSI14 at 65.79 signals strong intraday momentum without a blow‑off. At the same time, MACD line 0.60 above signal 0.32 with a histogram of 0.28 shows building upside pressure.
Bollinger Bands sit with the mid at 18.36 and an upper band near 20.78. Price is holding the upper half, consistent with control by buyers. Meanwhile, ATR14 at 0.68 implies ranges wide enough to test nearby levels. Hourly pivots frame 20.29 as the near‑term cap and 20.00 as first support.
15‑minute execution: constructive, minor hesitation
In the 15‑minute execution context, conditions stay constructive but show minor hesitation. EMA20/50/200 at 19.85/19.12/18.50 outline a well‑supported short‑term uptrend. RSI14 at 64.48 keeps buyers in control. However, MACD line 0.35 sits below signal 0.42 and a histogram of -0.08 flags a brief pause in micro momentum.
Bollinger Bands place the mid at 19.98 with an upper band near 20.64. Price holds above the mid‑band, leaving room for another push higher. Notably, ATR14 at 0.23 suggests quick rotations. The 15‑minute pivots highlight support at 20.11/20.04 and resistance at 20.27.
Notable context for SoftBank Group Stock
Notably, recent coverage highlighted a valuation check after a strong multi‑period run in SoftBank Group’s shares. That backdrop often sharpens sensitivity around resistance and can slow follow‑through as price meets supply. The technicals reflect that balance: trend is up, but daily momentum is no longer accelerating.
Bullish scenario for SoftBank Group Stock
Therefore, the bullish scenario remains the base case. A firm hourly close above 20.29 would open a retest of the daily upper band near 20.71 and the daily R1 20.80. That would confirm buyers can absorb overhead supply. Follow‑on strength through 20.80, with hourly momentum still positive, would extend the advance within the existing daily trend.
Bearish case and invalidation levels
In contrast, the risk case hinges on failure to hold nearby support. A slip back below 20.00 and the hourly pivot at 20.09 would signal fading intraday control.
A daily close back under 19.88 would weaken the bullish stance, while a move toward 19.26 (daily S1) would mark a more notable momentum fade. A deeper break toward the daily mid‑band at 18.29 or the EMA20 at 17.88 would undermine the trend structure and invalidate the near‑term bullish case.
Outlook: two‑way volatility near resistance
Overall, positioning favors the uptrend on the daily timeframe, with the hourly chart in support and the 15‑minute only pausing. However, nearby resistance at 20.27–20.29 and 20.71–20.80 argues for two‑way volatility. Respect the pivots and the elevated ATR backdrop as SoftBank Group Stock works through supply at the highs.


Ayrıca Şunları da Beğenebilirsiniz

Justice Department has 'gone off the rails' for Trump's 'pretzel logic': analysis

Wall Street Quietly Accumulating Bitcoin, Says Bloomberg ETF Analyst

Why Businesses Need Professional Machine Design and Development Services


Popüler Haberler
Daha fazla
