

Compare U.S. Stocks Side by Side
Compare S&P 500 stocks side by side using real-time market cap, P/E ratio, revenue growth, and analyst ratings, so you can make smarter trading decisions.

Not Sure Which Stocks to Compare? Start Here
Not sure which S&P 500 stocks to compare? These are the most popular stock comparisons traders are searching for right now, from NVDA vs AAPL to AMD vs INTC.
See Which Stocks Are Leading the Market
Compare U.S. Stocks by market cap and trading volume to see which companies are leading the market and which stocks are seeing the most action today.
Compare the market leaders
Compare market cap, valuation, and growth against the largest companies by market capitalization in the U.S. stock market.
See What Stocks Traders Are Watching
Compare trading volume and price momentum among the most actively traded U.S. stocks to spot where the market's attention is right now.
What You Get From Comparing Two U.S. Stocks
See exactly how two stocks stack up before you trade, without jumping between multiple sources or tools.
See the Full Picture
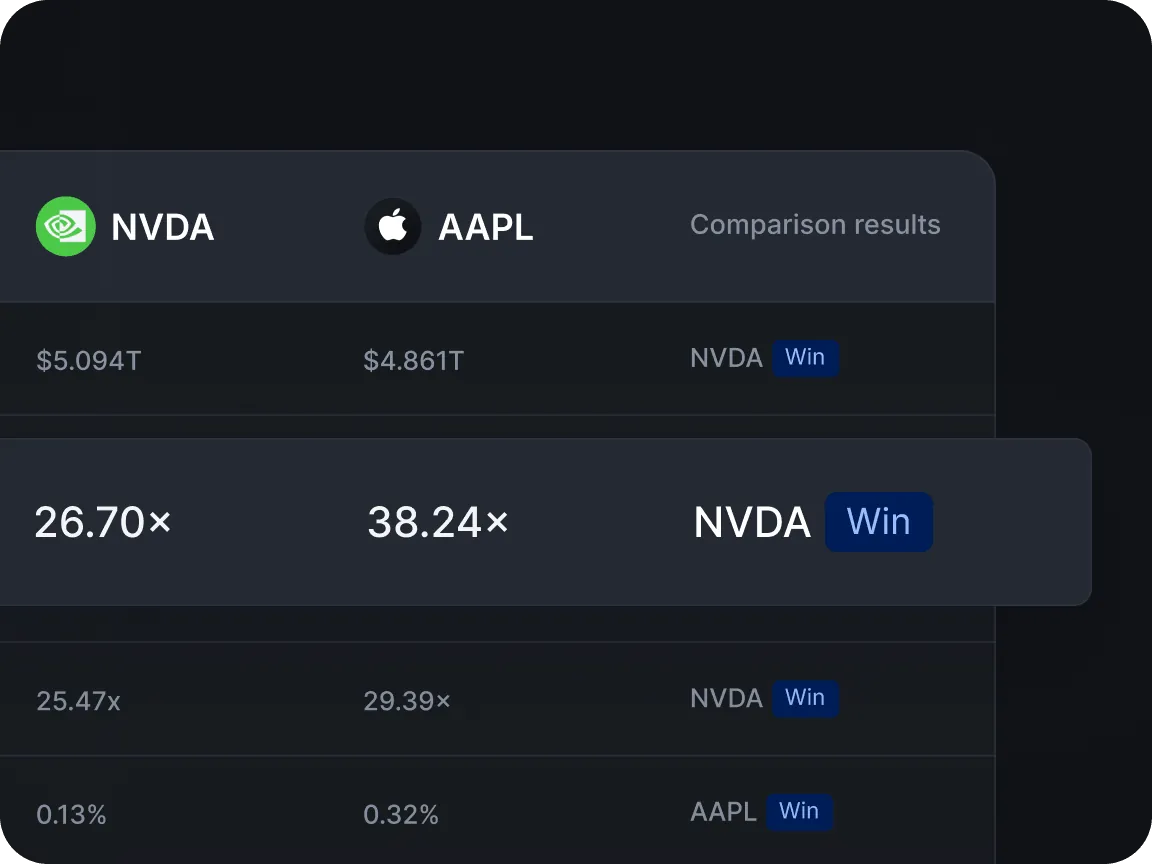
Market cap, valuation, growth, and analyst sentiment for both stocks in a single view.
Skip the Guesswork
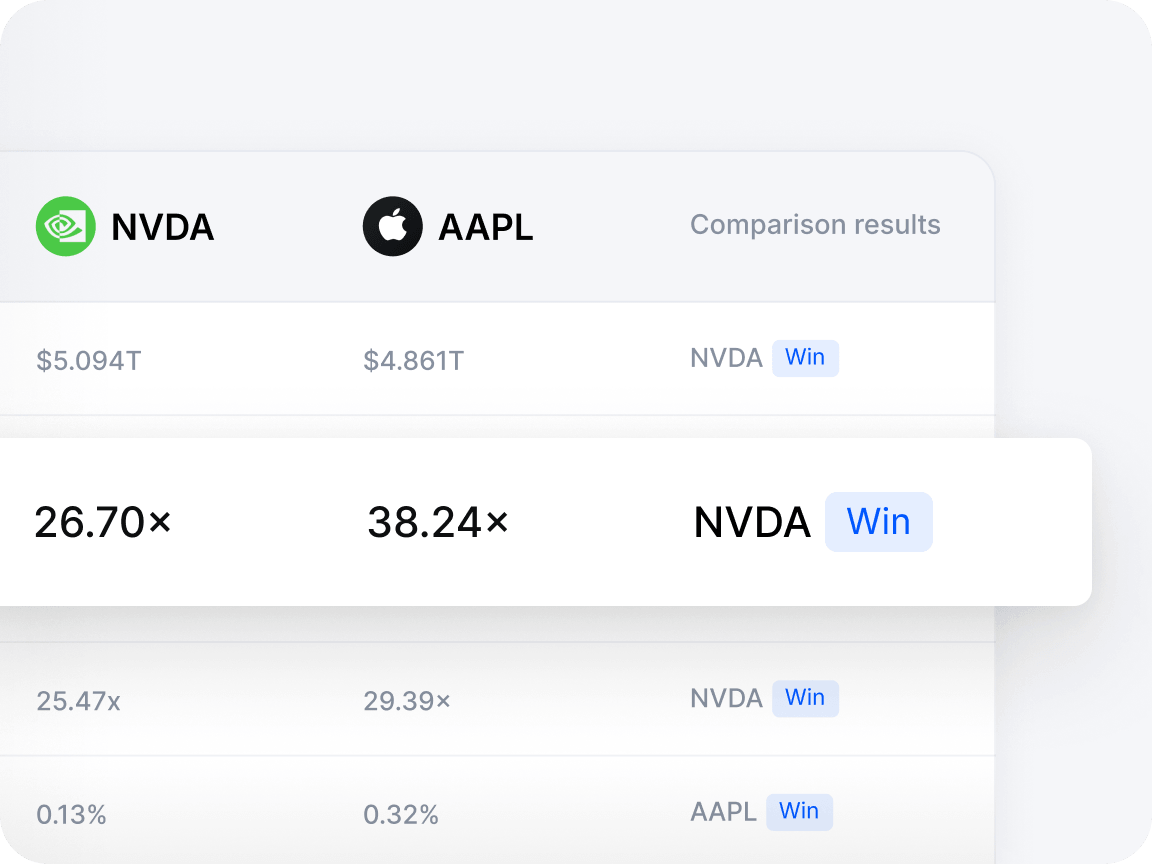
Spot the differences that matter instead of digging through separate stock pages.
Trade With Confidence
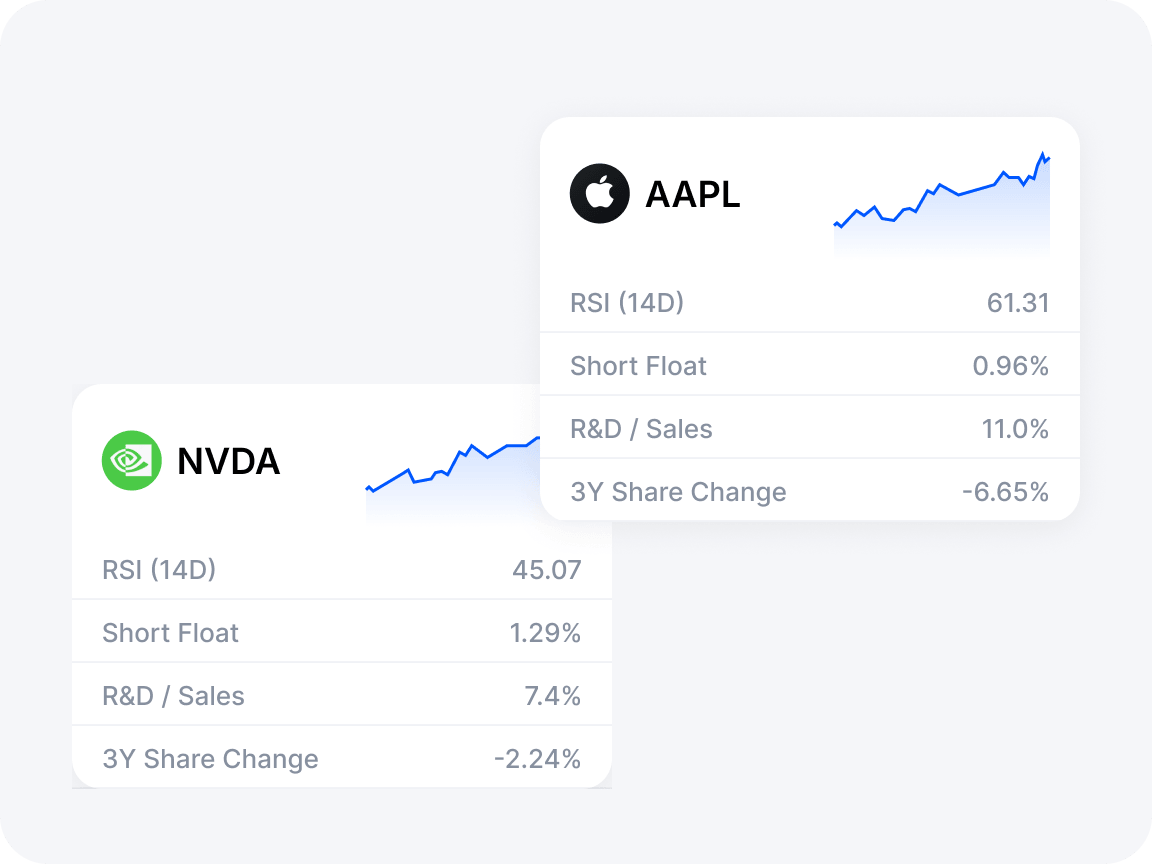
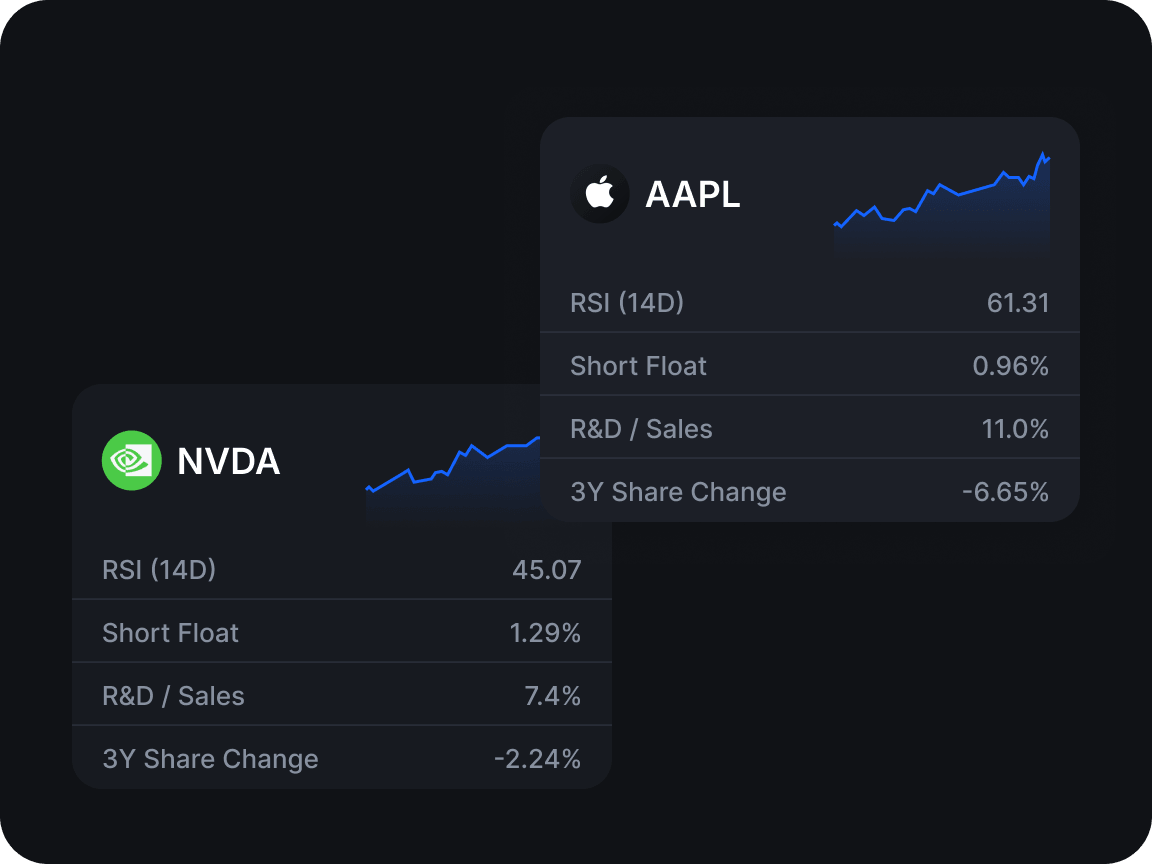
Walk away knowing exactly why one stock might suit your strategy better than the other.
How to Compare Two U.S. Stocks in 3 Steps
Learn how to compare stocks in three simple steps, from setting your investment goal to comparing stock fundamentals and assessing risk.
Start With Your Goal
Growth, income, or short-term trading? Your investment goal decides which stock comparison metrics matter most.
Compare the Fundamentals
Compare stock fundamentals side by side, including market capitalization, valuation, and revenue growth.
Check the Risk
Check stock volatility and analyst ratings to understand the risk behind the numbers before you trade.
What Traders Actually Look at When Comparing U.S. Stocks
These are the stock comparison metrics traders check most before comparing any two S&P 500 stocks, from market cap and P/E ratio to revenue growth and analyst ratings.
| Metric | What It Shows | What It Tells You |
|---|---|---|
| Market Cap | Company size | Whether you're comparing a stable giant or a smaller, higher-risk name |
| P/E Ratio | Valuation | Whether the stock is priced cheap or expensive relative to its earnings |
| Revenue Growth | Business momentum | Whether the business is accelerating or slowing down |
| Profit Margin | Profitability | Whether growth is actually turning into profit |
| Analyst Rating | Street consensus | What Wall Street analysts expect next |
| Volatility (Beta) | Price swings | How much the stock swings compared to the broader market |
Find Any U.S. Stock Comparison by Ticker
Search any stock ticker to find every available comparison, from head-to-head matchups like NVDA vs AAPL to full sector-by-sector stock comparisons.
| # | Stock | Trading Pairs |
|---|---|---|
| 1 | ||
| 2 | ||
| 3 | ||
| 4 | ||
| 5 | ||
| 6 | ||
| 7 | ||
| 8 | ||
| 9 | ||
| 10 |
Check Today's Biggest Movers Before You Decide
Compare today's top gaining and top losing U.S. stocks to see which names are moving the market right now.
Top Gainers
- Paramount Skydance CorporationPSKY+105.79%
- Treasure Global Inc.TGL+34.31%
- ClearOne, Inc.CLRO+33.51%
- Xencor, Inc.XNCR+30.35%
- Design Therapeutics, Inc.DSGN+30.05%
- VS Media Holdings LimitedVSME+28.05%
- KLX Energy Services Holdings, Inc.KLXE+27.64%
- Archimedes Tech SPAC Partners II Co.ATII+25.59%

- Presidio Production CompanyFTW+22.94%
- Surgery Partners, Inc.SGRY+19.43%

Top Losers
- Elme CommunitiesELME-96.19%
- BUUU Group LimitedBUUU-91.38%

- Aditxt, Inc.ADTX-77.70%
- ENvue Medical, Inc.FEED-74.11%
- Columbus Acquisition Corp.COLA-60.27%

- BNB Plus Corp.BNBX-58.08%
- Inflection Point Acquisition Corp. VIPEX-56.15%

- Functional Brands, Inc.MEHA-55.31%

- Flash Sports & Media Holdings, Inc.FLZH-54.91%
- OSR Health, Inc.OSRH-53.28%
Why Compare and Trade U.S. Stocks on MEXC


Competitive Fees
Trade U.S. stocks with competitive fees across RealStocks, Stock Futures, and Tokenized Stocks, with no hidden charges.


Flexible Ways to Trade
Trade RealStocks, Stock Futures, or Tokenized Stocks, whichever way of trading U.S. stocks fits your strategy.


Instant Access to the Hottest Stocks
Trade thousands of U.S. stocks in one account, from household names to top-tier stocks like SpaceX, Apple Inc., Tesla, and more.
View all S&P 500 stocks ›Disclaimer
This stock market data, indices, and related information displayed on this page are sourced from third-party providers and are for informational and educational purposes only. While MEXC strives to present accurate and timely information, we make no representations or warranties regarding the accuracy, completeness, or reliability of the data. This content does not constitute financial, legal, or investment advice. Users should conduct their own independent research. MEXC shall not be held liable for any trading decisions or losses incurred based on this information.